Metadata Driven ETL and Reporting with Pentaho Data Integration and Report Designer
Tutorial Details
- Software: If PDI Kettle 4.2 GA and PRD 3.8.1 GA or later are available, download them from Sourceforge, otherwise here: PDI/Kettle 4.2 latest stable version and PRD 3.8.1 latest stable version (Note: Do not use these last stable versions in a production environment)
- Knowledge: Intermediate (To follow this tutorial you should have good knowledge of the software and hence not every single step will be described)
- OS: Windows, Linux or Mac OS X
- Tutorial files can be downloaded here
Together we are stronger: Pentaho Data Integration and Pentaho Report Designer for total flexibility
Acknowledgment
I would like to thank both Matt Casters (Chief Data Integration, Pentaho) and Thomas Morgner (Chief Reporting, Pentaho) for providing me answers on all the questions that I had on this interesting topic.
Introduction
This tutorial will demonstrate how you can create extremely flexible data processing and reporting pipelines by using the metadata approach.
So what does Metadata Driven mean? Imagine you source various data fields from text files or a database, transform the data and then output a final pixel perfect report with summarized data. What happens if a new field shows up in the source data and it has to be added to the data processing and reporting pipeline? In the past this meant that you had to manually add this new field to nearly every step of your pipeline (change the ETL transformation and report template directly, or better said, hard code everything). Metadata driven means that you do not directly change ETL and reporting files, but only supply the name of the fields that have to be processed (and any other metadata).
This article focuses on three very interesting features in the Pentaho BI Suite:
- Metadata driven ETL processes with Pentaho Data Integration (Kettle)
- Index column reports in Pentaho Report Designer (PDR) which allow extremely flexible report definitions and can utilize the metadata provided by the data query
- Pentaho Report Designer can source data from a Kettle transformation … now this is an extremely powerful combination and opens up the door for a lot of new solutions
Now why do I think this is quite important:
- Some projects ask for a lot of flexibility in regards to ETL and reporting. New data points should be picked up ideally automatically and pushed to the report output. Now, by using Kettle and PDR together, you can even do this for real-time-reporting.
- Another example is template driven ETL. As a developer you can create ETL processes that you can easily reuse for a lot of projects without inventing the wheel over and over again.
- Using MDX output in PRD was a bit difficult at times. Imagine a scenario where you had to present the daily performance of the last 10 days. In MDX you can easily use a function to display the last 10 days. The result set might have the dates as columns, which is inconvenient, as they will always change. Hence so far you had to give each date column an alias (i.e.: “date_10_days_ago”) which would not change. Using an index column in PRD is extremely convenient, because you don’t have to worry about this complexity any more
- … and many more …
Certainly, this approach has its limitations. Not everything can just happen automatically, hence you have to consider carefully in which scenarios this approach will work well.
Creating a Metadata Driven Report
Defining the query
Open Pentaho Report Designer (PRD) and create a new report. Let’s set up a data source:
- Click on the Data tab
- Right click on Data sets and add a query (follow all the necessary steps)
- Click Ok
- Copy your query somewhere in a text editor or so to have it handy, then delete the data source in PRD
- So now there shouldn’t be anything under Data Sets. Right click on Data Sets and choose Advanced > JDBC (Custom). In the settings dialog choose your database connetion details and then click OK.
- In the data tab, create a new parameter called Query (type: string)
- Click on the Structure tab and mark the Master Report.
- Click on the Attributes tab and click on the query name value field. Insert your query here.
- Click on the query name formula icon (+) and insert following open formula: =[Query]

Do not drag and drop any fields onto the details band. Do not put any fields at all on the details band or the details header or footer! If you want to auto-generate the reports on the fly you have to use a scripted pre-processor to configure the fields based on the structure of the result set returned by the query and then the report design wizard generates the fields and formats for the report.
Thomas Morgner explains:
“A report-pre-processor is a specialized function that is executed after the report processing queried the data from the data-factory, but before the report's functions get initialized and the actual report-processing starts. Each master- and sub-report can have its own set of report-processors. The pre-processor is executed only once for each report-definition. At this point in the processing chain, a pre-processor has full control over the layout and data-computation aspects of the report-definition. The pre-processors are defined on the "advanced::pre-processor" attribute of the "master-report" object.”
Defining the report pre-processor
- Click on the Structure tab and mark the Master Report
- Click on the Attributes tab and scroll down to the wizard section
- Set wizard-enabled to true
- Scroll down to the advanced section
- Click on the value field of pre-processor
- Add a Relational Report Auto-Generator and Wizard Processor

Note: You can have a look at the code of the Relational Report Auto-Generator by clicking twice on the name in the above shown dialog, then on the right hand side a "..." button will show up. Click this one, another dialog will come up, click on the value field of the script row and you will be shown the whole script. If you want, you can edit it here.
|
PRD includes some examples of report-pre-processors:
- Flat output (RelationalAutoGeneratorPreProcessor): Places the fields in the detail band and the labes in the detail header
- WizardProcessor: Extended version of the one before, can be used as well to only refresh the metadata of predefined fields
- Most features (BSFReportPreProcessor): Use a scripting language to manipulate various settings
Again, these are only examples, you can build your own report-pre-processor.
The code for the report-pre-processor is stored as a expression-property within the report definition. The code uses the wizard-API to define the fields and then the wizard-process generates the fields. With this approach you can do whatever you want with the (GUI)-wizard itself.
In case your are aiming for really fancy reports, you can add another report-pre-precessor after the wizard processor to post-process the fields generated by the wizard.
Designing the report
- Expand the Structure tree and mark Details Header
- Click on the Attributes tab and set hide-on-canvas to false
- Do the same for the Details Footer
- Apply any format that you wish to the Details Header, Details and Details Footer (do not place any elements in these areas). I would advice to set at least font-size, text-color, background-color and height.
Note: If you want to use bands, make sure you click on the Attributes tab, scroll down to the wizard section and set generate-content-marker to true. Normally, if you define fields within the band, the wizard wouldn’t be used as the fields are explicitly set. By enabling generate-content-marker this behaviour is overwritten (the wizard removes your fields and brings its own fields).
|
Sample design:

Now click on the preview button and write any SQL query in the parameter field, then click Update. Your report will be generated on the fly and will look something like this:

Note: This report setup is for illustration purposes only. I strongly advice to be very careful with allowing users to directly enter queries as this is a good target for SQL injections. Somebody could just enter a DELETE statement and execute it. So make sure you have the right security in place in case you really have to use this setup.
|
Someone unfamiliar with Pentaho Report Designer might wonder what is metadata driven in this example? Well, normally we would define all the fields in the details header, details and details footer bands. Here we didn't define them at all, but relied on Pentaho Report Designer to make use of the query metadata and display the fields accordingly. This could be achieved by using the report pre-processer followed by the wizard functionality.
Together we are stronger: Pentaho Data Integration and Pentaho Report Designer for total flexibility
In this section I will try to highlight future potential of a metadata driven approach. Currently the tools don't have all the necessary features, hence I will point out at the end what new features should be ideally added.
Metadata driven ETL
Now that we know how to set up a metadata driven report, we can have a look at creating a metadata driven ETL process to supply data to our metadata driven report template.
PDI (Kettle) only recently received a new transformation step called ETL Metadata Injection. The idea is to have one transformation that acts as a metadata injector to the main transformation. This main transformation is a skeleton of an ETL process: All the steps are defined, but not all or most of the metadata.
Currently not all transformation steps support metadata injection. Find below a list of steps that currently work with the ETL Metadata Injection step (status: July 2011):
- CSV Input
- Excel Input
- Select Values
- Row De-normalizer
- Row normalizer
So right now, the possibilites are quite limited, but this list will be growing over time as people start submitting requests on the Pentaho JIRA website. So if you already have an idea as to which transformation step should have metadata injection support, visit the aforementioned website and submit a JIRA feature request (ideally check first if there is not already one set up).
If you use the Metadata Injector step and point it to the main transformation, it will show which steps are supported.
As Matt Casters put it: "The golden rule is: if the step doesn't show up, it's not supporting metadata injection yet".
We will be looking at an extremely simple example (tr_metadata_injection_main.ktr):
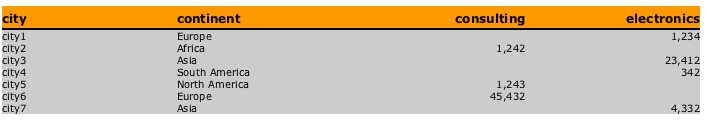
Image in we have a dataset which looks like this one:

Our ETL process should pivot this data in this way:
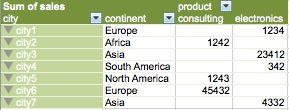
Now if our original dataset contains only a static number of product names (in our case: electronics, consulting), then we can easily set up a predefined ETL process. But what if the number of product names might change in future?
So far we only had the option to amend our ETL process manually, which means we had to edit our Kettle transformation and add the new name(s) to the Row denormalizer step. This was rather inconvenient as ideally this should have been picked up automatically. The great news is, that now this is possible with the ETL Metadata Injection step.
Create following table on your database of choice (amend if necessary):
USE
test
;
CREATE TABLE
product_sales
(
city VARCHAR(20),
continent VARCHAR(20),
product VARCHAR(20),
sales INT(255)
)
engine=innodb
;
INSERT INTO
product_sales
VALUES
("city1","Europe","electronics",1234),
("city2","Africa","consulting",1242),
("city3","Asia","electronics",23412),
("city4","South America","electronics",342),
("city5","North America","consulting",1243),
("city6","Europe","consulting",45432),
("city7","Asia","electronics",4332)
;
Now let's create our transformation based on the screenshot below:

This transformation will query data from the table we just created. The Select values step allows use to keep only the required fields (It's not really useful in this example, but mainly here for demonstration purposes). Next the data goes into the Row denormalizer step, which basically pivots our data.
To test this transformation I suggest adding a Text file output step and filling out all the required settings in all the steps. Once this works, change the settings of the relevant steps and hops so that they look like the ones shown in the screenshot above. As you can see, we leave the Select values step completely unconfigured and for the Row denormalizer step we only define the Key and Group by fields. Everything else we will configure by using the ETL Metadata Injection step.
We create a second transformation (tr_metadata_injection_config.ktr) to supply the metadata to our main transformation:
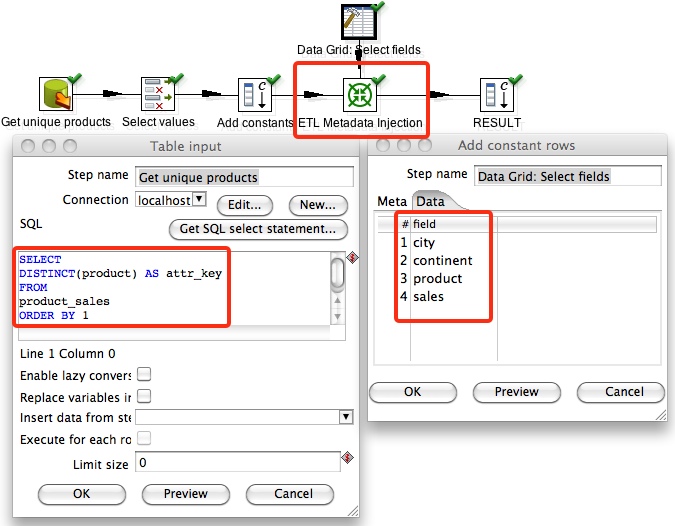
First off we have to get the unique product names in order to pivot the data correctly. We use a Table input step therefore with following query:
SELECT
DISTINCT(product) AS product
FROM
product_sales
;
For this stream we also add some additional fields to have all the metadata complete for injection to the Row denormalizer step in our original transformation.
We also use a Data Grid step to define the fields that we want to keep for the Select values step in our original transformation.
Now we can map our metadata with the steps of our original transformation:
- Double click on the ETL Metadata Injection step and the settings dialog will pop up.
- Click the Browse button to choose which transformation you want to inject metadata to.
- Click Ok, then double click again on the ETL Metadata Injection step and you will see a tree-like representation of your main transformation. For each step you see all the settings that can be used by the metadata injection. You do not have to provide all of them though, but definitely the essential ones. If you are unsure as to what the essential once are, then just create a separate testing transformation and test which settings are necessary for a certain step to work properly.
- For the settings that you want to provide metadata for, click on the Source step field in the respective row and a dialog will guide you through the mapping:
- As we want to use the output of our original transformation in this current transformation, we also define the Row denormalizer step as Source step to read from (optional).

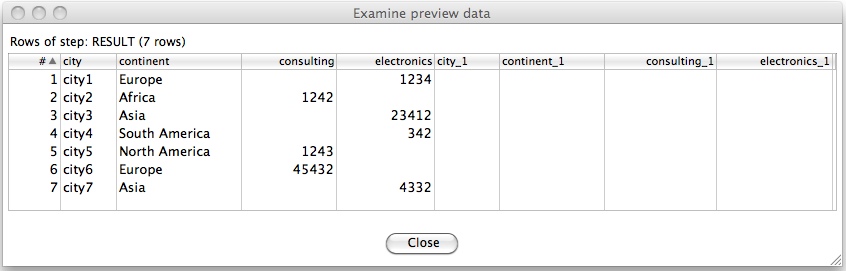
By using the Add constant values step, we can define the fields and field types that we expect to be return from the metadata injected transformation. In our case it will look like this:

At runtime the ETL metadata injection step will output fields of the same name and pass them to the Add constant values step. As this last step adds field that already exist in the input stream, these field names will be automatically to _1 since they are duplicates.
Note: You execute the original transformation by running the metadata transformation. So in our example, you would run tr_metadata_injection_config.ktr.
|
So let's test our setup: Mark the Result (Add constant values) step in tr_metadata_injection_config.ktr and click the Preview button. The output will look like this:
PDI Data Source in Pentaho Report Designer
Now that our metadata driven ETL process is running successfully, the next step is to use this data directly for the report output. In Pentaho Report Designer we can define a PDI transformation as a data source:
- Open Pentaho Report Designer
- Create a new report
- Click on the Data tab
- Right click on Data Source and choose Pentaho Data Integration
- In the dialog click on the (+) button to specify a new query
- Click on Browse to find the metadata configuration transformation we just created
- Mark the Result step and click Preview
- Click Close followed by OK
- Define the report-preprocessor and wizard as described in the Defining the report pre-processor
- Design the report as described in Designing the report
- Preview the report. It should now look something like this:


Room for improvement
As you can see, the only problem currently is that there is no way to pass the dynamic Kettle dataset to PRD - that is why we had to use a work-around. If a new product name shows up, we still have to change the Result (Add constant values) step in our example. Now imagine the possibilites if a future version of PRD would accept dynamic Kettle datasets: In our example we would not have to change anything. The new product name would automatically be passed on to the report output.
Let's add a new product name to our table (use your favourite SQL client):
INSERT INTO
product_sales
VALUES
("city1","Europe","photography",342)
;
In Kettle (Spoon), mark the ETL Metadata Injection step and click on Preview. You will see that our new product name was automatically added to the result set:

The problem now is that we have to manually at this new field name to the Result (Add constant values) step in order for PRD to be able to read it.
The main improvement should happen in PRD to allow dynamic PDI input. PRD already allows dynamic input for most other data source, so adding this feature for PDI data sources should not be a lot of work.
Working with fixed width MDX output in Pentaho Report Designer
We will now have a look at how to easily work with a fixed width MDX result set in Pentaho Report Designer. As mentioned before, sometimes you might have a result set with changing column names. Imagine we have a daily summary for the last 10 days. Each column name has the actual date. Now if I run the same query tomorrow, the column names will have changed. PRD has a feature called index column: So instead of referring to the column names, it allows you to refer to the column position.
For this example here I will reuse an existing PRD example query so that everyone can follow easily:
Changing the Report Designer settings
Before we can get started, we have to enable a special setting. Open up the Pentaho Report Designer and go to Edit > Settings > General and enable Display the index columns in the Report-Designer’s field selectors:
Defining a query
- Create a new report
- Click on the Data tab
- Right click on Data Source and choose OLAP > Pentaho Analysis
- Define the OLAP schema file: steelwheels.mondrian.xml. This file should be in the same location as this report.
- Mark following database on the left hand side: SampleData. This database comes with PRD, so you don't have to worry about anything here.
- In the dialog click on the (+) button to specify a new query (copy the query shown after this numbered list).
- Click Preview
- Click Close followed by OK
- Notice that apart from the standard fields the index fields are shown as well in the Data Sets overview:
Now we can just drag and drop these index fields on the canvas as we would do with standard fields. - Drag and drop the index fields in the details band.
- Do exactly the same for the details header. Mark all of the details header fields and choose Format > Morph > label.
- Mark all the index fields (in the details band and in the details header) in the Structure tree using CTRL, go to the Attributes tab and enable following attributes for query-metadata:
data-format: true
style-format: true - For each index field in the details header, set the labels-detail-header attribute respectively (i.e.: ::column::0)
- If you wish, apply additional formats to the report
- Preview the report. It should now look something like this:


MDX to copy (this query actually comes with one of the PRD examples):
with
set [TopSelection] as
'TopCount(FILTER([Customers].[All Customers].Children,[Measures].[Sales]>0), Parameter("TopCount", NUMERIC, 10, "Number of Customers to show"), [Measures].[Sales])'
Member [Customers].[All Customers].[Total] as 'Sum([TopSelection])'
Member [Customers].[All Customers].[Other Customers] as '[Customers].[All Customers] - [Customers].[Total]'
select NON EMPTY {[Measures].[Sales],[Measures].[Quantity] } ON COLUMNS,
{ [TopSelection], [Customers].[All Customers].[Other Customers]} ON ROWS
from [SteelWheelsSales]
where
(
strToMember(Parameter("sLine", STRING, "[Product].[All Products].[Classic Cars]")),
strToMember(Parameter("sMarket", STRING, "[Markets].[All Markets].[Japan]")),
strToMember(Parameter("sYear", STRING, "[Time].[All Years].[2003]"))
)
As we don't know the field values upfront, we also have to make sure that extremely long values can be handled gracefully. This is out of scope of this article.
Working with dynamic MDX output in Pentaho Report Designer
Now we want to actually go a step further and use dynamic MDX results. For this scenario we will not make use of index fields, but follow the same approach as before with the PDI data source. We use exactly the same query again, but theoretically you could now use any MDX query:
- Open Pentaho Report Designer
- Create a new report
- Click on the Data tab
- Right click on Data Source and choose OLAP > Pentaho Analysis
- Define the OLAP schema file: steelwheels.mondrian.xml. This file should be in the same location as this report.
- Mark following database on the left hand side: SampleData. This database comes with PRD, so you don't have to worry about anything here.
- In the dialog click on the (+) button to specify a new query (copy the query shown after this numbered list).
- Click Preview
- Click Close followed by OK
- Define the report-preprocessor and wizard as described in the Defining the report pre-processor
- Design the report as described in Designing the report
- Preview the report. It should now look something like this:
MDX to copy (this query actually comes with one of the PRD examples):
with
set [TopSelection] as
'TopCount(FILTER([Customers].[All Customers].Children,[Measures].[Sales]>0), Parameter("TopCount", NUMERIC, 10, "Number of Customers to show"), [Measures].[Sales])'
Member [Customers].[All Customers].[Total] as 'Sum([TopSelection])'
Member [Customers].[All Customers].[Other Customers] as '[Customers].[All Customers] - [Customers].[Total]'
select NON EMPTY {[Measures].[Sales],[Measures].[Quantity] } ON COLUMNS,
{ [TopSelection], [Customers].[All Customers].[Other Customers]} ON ROWS
from [SteelWheelsSales]
where
(
strToMember(Parameter("sLine", STRING, "[Product].[All Products].[Classic Cars]")),
strToMember(Parameter("sMarket", STRING, "[Markets].[All Markets].[Japan]")),
strToMember(Parameter("sYear", STRING, "[Time].[All Years].[2003]"))
)
The disadvantage of this approach is that the column headers are not particular nice to read ... but there might be a way to control this.
Conclusion
Exploring these advanced features of Pentaho Data Integration and Report Designer has been an extremely interesting journey. There are many more features available which couldn't be covered in this tutorial. I suggest that you take this information here as a starting point and explore all the possibilities if you have time.
Overall, if the next version of PRD brings dynamic PDI data source support, there will a huge potential available. Over the time, PDI will also add additional ETL steps for metadata injection and then our journey will even get more exciting!
Hi,
ReplyDeleteGood work!
But whats running in my mind is, does this index column idea work within calculated formulae?
Thanks a lot for your feedback! Can you give me an example in regards to the calculated formulae? Is this for calculating new data points or in regards to determine the design at runtime?
ReplyDeleteIt was a silly question, i then wanted to use these index columns within my open formula and yes, it does just fine!
ReplyDeleteok, no worries.
ReplyDeleteHi,
ReplyDeleteThanks for such a nice article. I got a doubt in your metadata injection ETL section.
how could you get the source field name viz.value_field,attr_key,attr_label,attr_data_type to specify in the dialogue box of the etl metadata injection?
looking for an early reply...
Regards
soumik
Thanks for your feedback! You can just select the source step from the pull down menu.
ReplyDelete