Wednesday, October 31, 2012

Experimenting with new layout features in PRD


Experimenting with new layout features in PRD

Note: This article will cover features that are still in development. We take a first look at them, do not expect them to be feature complete and do not use them in production.

All layouting strategies mentioned in this blog post are available for download here.

To experiment with the new features yourself, download the latest PRD build from http://ci.pentaho.com/

Place data rows next to each other

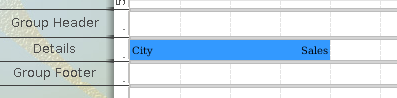
The standard detail layout places one row below the other:

A new feature allows us to actually place each row next to each other:

Our sample dataset:


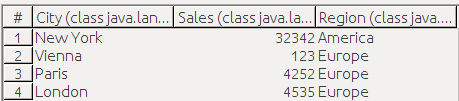
We set up Region as a group. Our report looks like this:


The report preview looks like this:
Compare the preview with the dataset above: You will see that a new details row was created for each group, and that the data rows were placed next to each other.
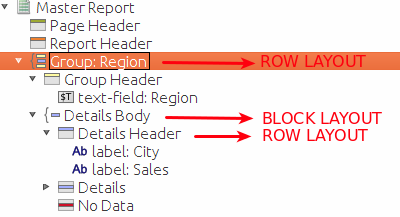
You can implement this the following way:


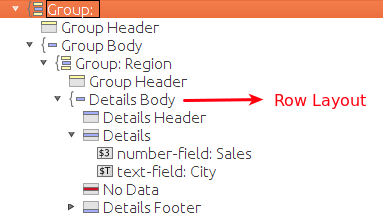
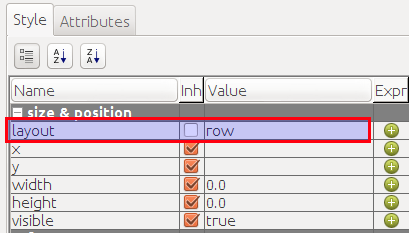
Simply select the Details Body in the Structure tab and in the Style tab set layout to row:

Make the group header part of the details section

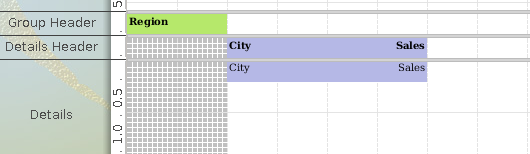
And here is how the preview of the report looks:

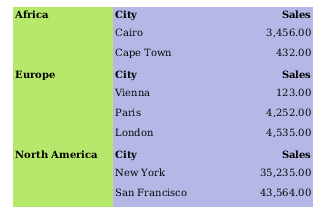
And here is how you can implement this layout:


Set the layout type as shown above for each band. Here an example for the Group:
Note: Currently you cannot set the elements within the group header to 100%, but it will be possible in future. I implemented a workaround by using a formula to dynamically increase the size of the header element to whatever height the details band and header are consuming.

Table Layout

Although the table layout has been available in the trunk version of PRD for some time (see Thomas’ original blog post), there has hardly anything been written about it.

The table layout available currently is mainly aimed at driving the crosstabs - nevertheless we can have a look at experimenting a bit with it. There is also no wizard or easy GUI available for to create a table [but there is one for crosstabs], so it is not that straightforward to create a table. Also it helps, if you are familiar with the HTML table layout.

Note also, that although you can create tables via the GUI, it is currently not possible to adjust the column widths individually. You can give the first column a specific width and all the other columns will automatically have the same width applied.

As you see, it is a start of having something similar to a table available within PRD. Current efforts of the PRD development team are mainly focused on finishing the cross tabs functionality and any table specific features will have to come after this. This doesn’t stop you though from submitting requests to jira.pentaho.org.

So now lets have a look how a table can be possibly created (info kindly provided by Thomas):

table-header, table-body and table-footer are all variations of a table-body. You will also need table-rows and table-cells to make it work properly.

I would do it in the following way:
group: table
group-header: table-header
 + subband for table-row
    (child elements will be automatically wrapped into a table-cell)
details-body: table-body
   itemband: table-row
group-footer: table-body

(table-footer is not implemented. But if it were, then the table requires it to follow directly after the table-header. See HTML standard for reference.)

I managed to get it working the following way:


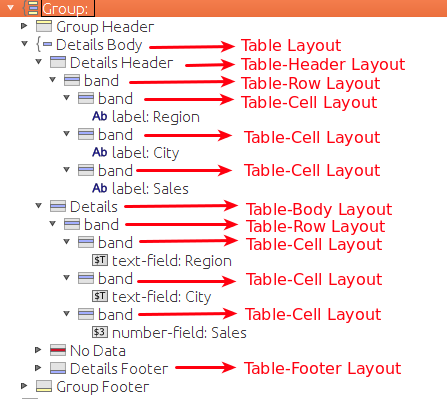
I added the extra band element with a table-cell layout to get this working, which normally should not be necessary - this a known bug.

The report looks like this in preview:


I hope you enjoyed seeing some new layouting features of PRD in action. Although they are not ready yet for production, it at least gives you some new ideas what you will be able to do in future.

Tuesday, October 30, 2012

Jasper Report: Gracefully Hide Columns On Request

For some reports you might want to offer the end users some more flexibility in terms of which columns they actually want to see in the report.
Documentation about this feature is scarce. When I was looking at a solution for this request some time ago I coincidentally stumble across Nestor's blog post (Some years ago, when I was living in Miami, Nestor and I used to work for the same company), which I found very useful.

Our requirement is that when a column is hidden it must not consume any space, meaning all columns to the right of it move gracefully to the left. This can be achieved using the table component. 
Our initial report looks something like this:


Define a parameter (i.e. SHOW_CONTINENT) and set its type to Boolean. 
Set the default value to:


new Boolean(true) 

and tick Use as a prompt.

Note: This parameter does not have to be passed to the subdata set!

Screenshot: iReport - Parameter Properties
Screenshot: JasperStudio - Parameter Properties
In the table mark the header column element for the column which you want to hide on request. It is best to select this from the Document Inspector - make sure it is the column and not the element within the cell: 
Note: It does not really matter on which level (table header, column header, detail etc) you select the column.

In the Properties set the Column Print When condition to:

new Boolean($P{PARAMETERNAME})

Screenshot: iReport - Column Properties
Screenshot: JasperStudio - Column Properties
Let's now preview the report. When asked if we want the continent column displayed, we say yes:
Now let's preview the report with the continent column disabled:
As you can see from the screenshot the continent column is not shown and the country, city and sales columns all nicely moved to the left.

Thursday, October 25, 2012

Jasper Report Bursting with Pentaho Data Integration (Kettle) using a REST service

Jasper Report Bursting with Pentaho Data Integration (Kettle) using a REST service

JasperReports Server 4.7 comes with some very useful REST services, one of them being a report creation service. The nice thing about this is that it is extremely easy to call this service.

Imagine our company has several regions and each regional managing director should receive a customized report. As the layout is the same for every region, we can just create one report that we parameterize so that we can display the data that is relevant for each region.

We have the contact details stored in a central database. As other projects already make use of Pentaho Kettle for data integration purposes, we decide to use it as well for our project. The outline of our report bursting process is as shown below:

So we first get all the contact details and then execute the report generation process for each one of these contacts.

As we want the whole process to be easily configurable we add these variables:

The transformation for retrieving the contact details is quite straightforward: Get the data from the database table, check if the email address is valid and copy rows to results:
Let's have a look now at the report generation process, where things get more interesting: 
So we set all the variables (the values are the contact details), we set the variable for the temp directory, then we create the report folder inside the temp directory if it doesn't exist already, after this we delete any files that could be in this report directory already. 

Now comes the important part: We use the HTTP job entry to call the JasperReports Server REST service.

In the General settings of this job entry we provide following URL details:

${VAR_JRS_URL}/rest_v2/reports/${VAR_JRS_DIR}/${VAR_REPORT_NAME}.${VAR_REPORT_OUTPUT_FORMAT_EXTENSION}?j_username=${VAR_JRS_USERNAME}&j_password=${VAR_JRS_PASSWORD}&CUSTOMER_ID=${VAR_CUSTOMER_ID}

As you can see this URL gets dynamically created by using some of the variables we set in the main job and also one report parameter value we retrieved from the contact details (VAR_CUSTOMER_ID). There are various output formats available for the report, in this example we use pdf, but it could also be xls, html etc.

The webserver reply should be stored in the target file (in example):
${VAR_TEMP_DIR}${VAR_REPORT_DIR}/${VAR_REPORT_NAME}-${VAR_CUSTOMER_ID}.${VAR_REPORT_OUTPUT_FORMAT_EXTENSION}


As there might be cases where for a certain parameter value there is no report data and hence no report created, we want to next check if there was actually a report created. If there is no report available, we just end this job gracefully, otherwise we execute the transformation which sends out the email:


In this transformation we get following variable values and assign them to fields:

The path to the report is dynamically created by using this Java expression:
TEMP_DIR + REPORT_DIR + "/" + REPORT_NAME +"-"+ CUSTOMER_ID + "." + REPORT_OUTPUT_FORMAT_EXTENSION

Finally the email settings are defined and the email is sent out with the report as attachment.

Most work in this process is dedicated to creating the report bursting functionality, accessing the JasperReports REST service is actually the easy part. The big advantage of this approach is also that you do not need a dedicated plugin to execute the Jasper report on the server and get the result back.