Pentaho Report Designer: Creating a Bar-Line Chart with Secondary Axis in Different Format
Tutorial Details
- Knowledge: Intermediate (To follow this tutorial you should have good knowledge of the software and hence not every single step will be described)
- Tutorial files can be downloaded here
Pentaho Report Designer offers a wider variety of chart types. Today we will look at the bar-line chart type. We will create a secondary axis and apply a different format on it. Our final chart will look like this one below (This is a chart created in 2 minutes, if you spend 2 minutes more, it will even look better):

I will not explain everything step by step but only focus on how to set up a chart which is based on data similar to the one shown below:

As you can see, the data set consists of impressions and click thru rate (CTR) broken down by option. In our chart, we want to display the impressions as bars and the CTR as a line. The only complexity that we have here is that CTR should be shown as a percentage whereas the impressions as standard integer values. So how does this work?
The most important point is that although in this case we only have one data set, for the chart we have to define two data sources, as our measures have different formats.
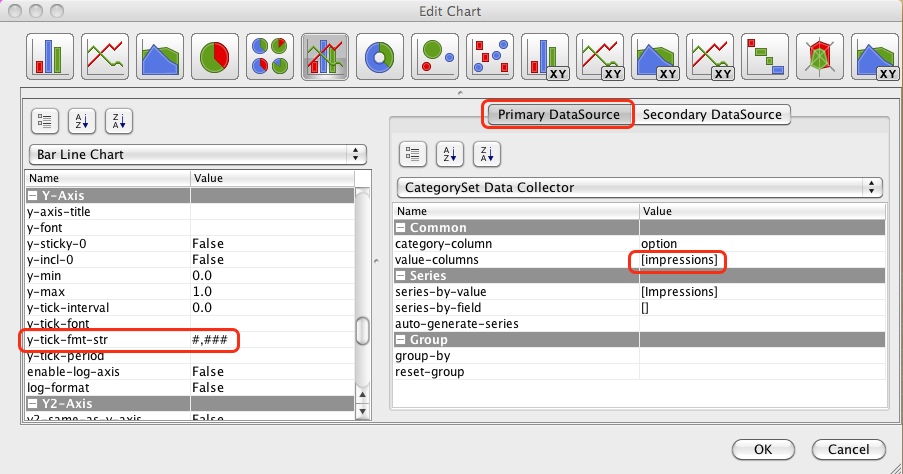
First we will define the settings for the bars (I only mention the very important points here):
- In the Primary DataSource settings we only define [impressions] in the value-columns
- The format can be defined with the y-tick-fmt-str
Thereafter, we click on Secondary DataSource:
- We define [CTR] for the value-columns
- Now we would expect something like y2-tick-fmt-str, but this one strangely enough doesn't exist. Instead, the format for the line has to be set in line-tick-fmt:

Provide all the other necessary details in the settings dialog and then the chart should be displayed perfectly.
Update: Thomas was so kind to create a bug report so that name of the secondary axis format string will be changed in future releases. Please add your vote here: http://jira.pentaho.com/browse/PRD-3459
ReplyDeleteI have a question, i can display the impressions as bars and lines?
ReplyDeleteBecause I want to make this graphic with one unique data sources, the same to bars and lines. It this possible? What parameters must put in the Secondary DataSource.
I apreciate your help. Sorry for my english. I speak spanish
I am not quite following your question: You want to display impressions as bars and lines in the same chart? Why would you want to do this?
DeleteIs this option present in pentaho CDE ??
ReplyDelete