I just read some pretty exciting news: All the Big Data features in Pentaho Data Integration (Kettle) will be made available in the open source version. This means you have now free access to all the Hadoop, Cassandra, HBase, MongoDB steps and job entries, a move which will certainly increase the popularity of this ETL tool even further. The Kettle GUI allows you to easily create transformations and jobs which import, transform, export etc your data.
You can find a very interesting tutorial on how to design a MapReduce job with Kettle here.
Monday, January 30, 2012
Saturday, January 21, 2012
Comparison of resource sharing features in open source reporting
Comparison of resource sharing features in open source reporting tools
In large scale reporting projects sharing resources is key for efficiency. This article tries to compare the three most popular open source tools to understand to which extend their feature set supports the various resource files that are likely to be shared.As an example: Maintain style definitions in a centralized global file. Instead of having to change a particular style in all the reports, this can simple be done in one global file. The clear advantages are: (1) It saves a lot of time and (2) consistency: every style is defined the same way for all reports and it is not as error prone as changing the style in every report.
Apart from styles there are several other report properties which can be maintained in global external files to achieve a similar effect.

Sunday, January 8, 2012
Book review: Agile Analytics: A Value-Driven Approach to Business Intelligence and Data Warehousing: Delivering the Promise of Business Intelligence

With "Agile Analytics: A Value-Driven Approach to Business Intelligence and Data Warehousing: Delivering the Promise of Business Intelligence" Ken Collier introduces agile methodology to BI projects. Readers new to the agile methodology will find a detailed introduction (i.e. What are user stories? How do I conduct an agile project?), learn about the iterative cycles (sprints) which allow feedback driven development, various other approaches like test driven development, continuous integration and much more. Ken Collier also introduces the Message Driven Warehouse which among other benefits allows to easily and quickly implement new requirements.
In a nutshell, it is one of the best books on BI which I read last year, so I can only highly recommend it.
Sunday, November 27, 2011
Jasperwave - the other JasperReports Designer
It's always good when there is new competition on the field: Jasperwave is a recent project on creating a very user-friendly JasperReport Designer. Currently it is at version 0.9.2 and available both as Eclipse plug-in as well as standalone client from here.
I have to say that for such an early version it is already a very impressive offering. All the basic functionality is covered, sub-reports are partially implemented and support for tables and crosstabs is coming with the next release.
Overall, this report designer shows huge potential and I am looking forward to the next release! In the meantime, check out the current version here.

Saturday, November 19, 2011
Jaspersoft iReport: How to pass a parameter to a sub-dataset
Jaspersoft iReport: How to pass a parameter to a sub-dataset
Let’s say our main report is grouped by continent and the details band holds sales figures for each country. We would like to add now a pie chart to the group footer to visualize the share by product by continent.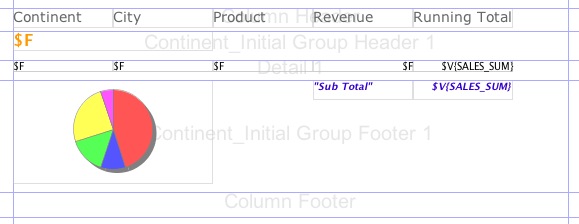
Imagine our main report query is:
SELECT
product_sales.`continent` AS product_sales_continent,
product_sales.`city` AS product_sales_city,
product_sales.`product` AS product_sales_product,product_sales.`sales` AS product_sales_sales
FROM
`product_sales` product_sales
ORDER BY
1, 2, 3
To add a sub-dataset right click on the report root element and choose New Dataset:

Follow the wizard instructions and insert a query. In our imaginary case it is something like this:
SELECT
product_sales.`product` AS product_sales_product,
SUM(product_sales.`sales`) AS product_sales_sales
FROM
`product_sales` product_sales
GROUP BY 1
ORDER BY 1
You must have noticed that there is something missing: This is of course not our final query, we want to restrict the results by continent. In order to do that, we have to first pass the parameter to the sub-dataset.
Now let’s have a look at how this is done:
- Create the parameter within the sub-dataset:
Give it a name in the properties panel and make sure that the parameter class is the same as for the parameter that you want to pass from the main query. Also, untick Use as a prompt:
- Now add a chart to the design area. Right click on it and choose Chart Data:
- Specify all the standard settings for the chart (Connection etc), then click on Parameters and Add. From the top pull down menu Dataset parameter name choose the sub-dataset parameter we just created before. Click on the button next to Value expression: You can now choose from the parameters, fields and variables of the main dataset. In our case, we just choose the continent field:
Apply, Click Apply, OK, and Close.
- Now we can finally change our SQL query in a way that it looks like we originally intended it to be. Therefore, right click on the dataset and choose Edit Query:
Now add a WHERE clause to the query like this one:WHERE
product_sales.`continent`=
From the right hand side, you can drag over the parameter. It should then look like this:OK.


For your reference, please find the whole last SQL query below:
SELECT
product_sales.`product` AS product_sales_product,
SUM(product_sales.`sales`) AS product_sales_sales
FROM
`product_sales` product_sales
WHERE
product_sales.`continent`=$P{CONTINENT_CHART}
GROUP BY 1
ORDER BY 1
Now everything will be working as intended. The parameter will now be passed from the main report to the chart (which is kind of a hidden sub-report). This method works for Lists, Tables and Crosstabs as well.
Friday, November 4, 2011
Star Schema Modeling with Pentaho Data Integration
Star Schema Modeling with Pentaho Data Integration
Tutorial Details
Now why is this new feature so noteworthy:
Update: The Star Modeler was open sourced and is included in the latest versions of PDI/Kettle. Disregard the paragraph below.
The plug-in architecture of PDI allows to add new features quite easily. The Star Modeler can be downloaded from here (status: 2011-11-04). Unzip the file in the PDI plug-ins folder and (re)start Spoon. The Star Modeler will now show up as an additional perspective on the top right hand side.
Note: As said, this feature is still in development, so not everything might work as expected.
CREATE SCHEMA
source_db
;
USE
source_db
;
CREATE TABLE
revenue
(
date DATE,
country_iso_code VARCHAR(3),
revenue DECIMAL
)
;
INSERT INTO
revenue
VALUES
('2011-11-01','GB',22314),
('2011-11-02','GB',23411),
('2011-11-03','GB',22325),
('2011-11-04','GB',22233),
('2011-11-01','US',32423),
('2011-11-02','US',25325),
('2011-11-03','US',43523),
('2011-11-04','US',23453)
;
CREATE TABLE
Countries
(
country_iso_code VARCHAR(3),
country_name VARCHAR(100)
)
;
INSERT INTO
Countries
VALUES
('GB','United Kingdom'),
('US','United States of America')
;
Now let’s create our target database:
CREATE SCHEMA
target_db
;
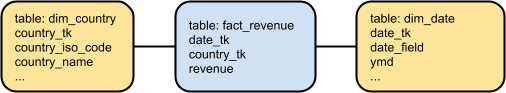
Our aim is to create this rather simple star schema:
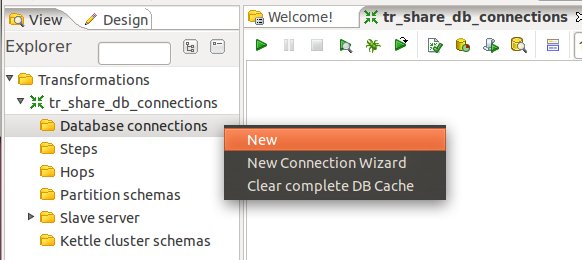
Click on the View tab and right click on Database Connections. Click on New then. Fill out all the details for both connections.
Once done, right click on them and choose Share:

Note: There will be a better way to define database connection details to be used with the Star Modeler in future.
Save your transformation.
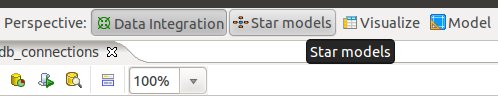
Now that we have the connection details defined, let’s click on the Star Models perspective in the right top hand side corner:
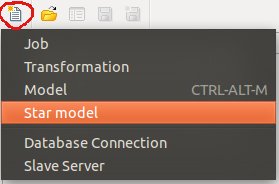
You will be greeted by a blank screen. Now click on the New icon and choose Star Model:
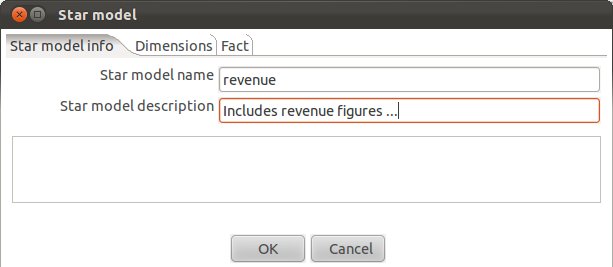
Give the star model a name and description. Then choose target_db as our target database.
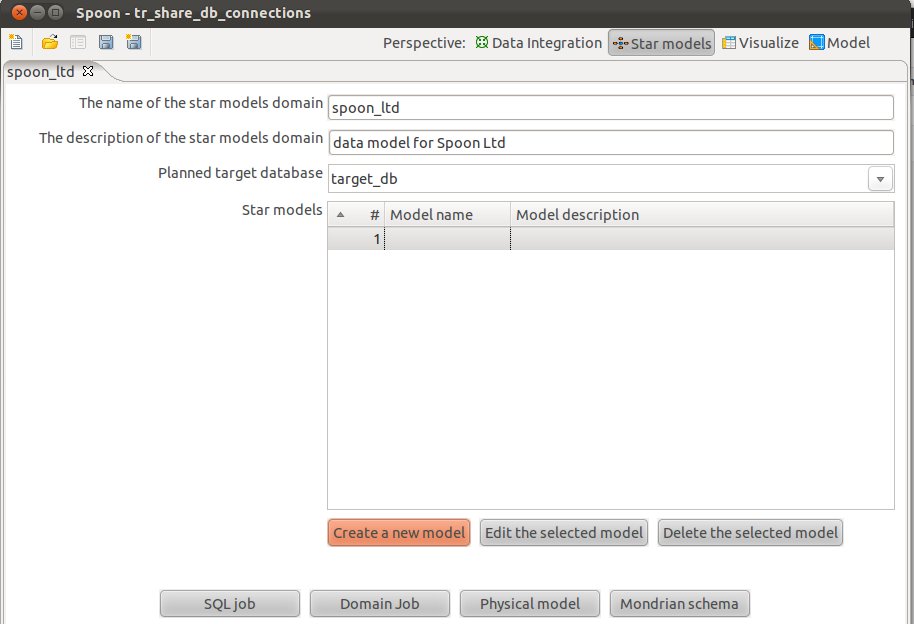
Click on Create New Model and fill out the form as shown below:
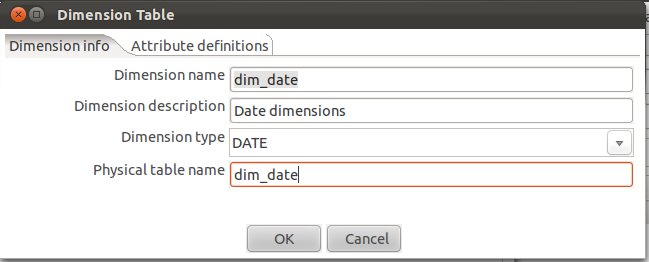
Let’s create our date dimension: Fill out as shown below. Make sure that you choose DATE as Dimension Type.
Now click on the Attributes definitions tab and then on Add default dimension fields:
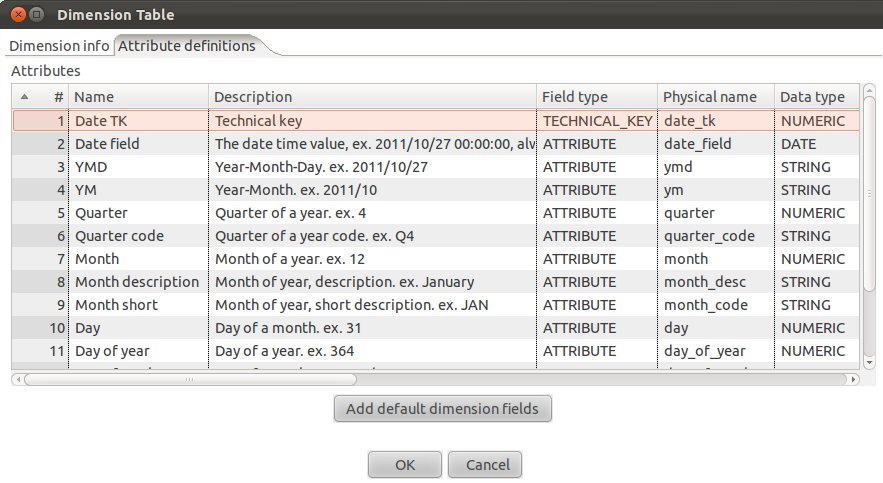
You will realize that PDI proposes a quite complete date dimension structure out-of-the-box. What a time saver! We are for now quite happy with this (if you want, you can change this), and click on OK.
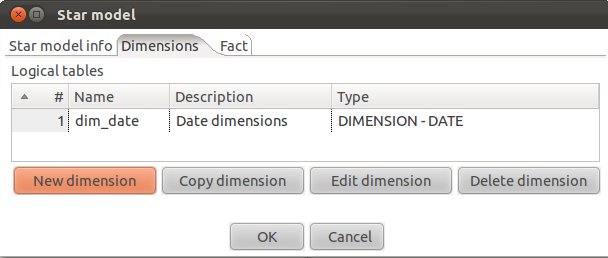
So we have now defined our date dimension. Let’s go ahead and work on our country dimension:
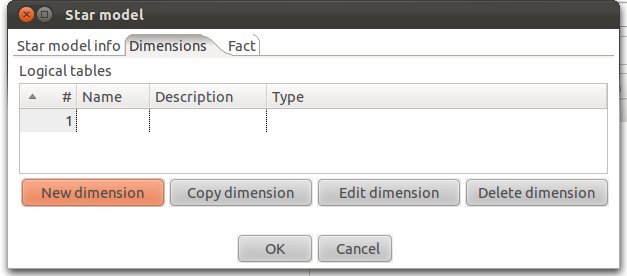
Click on New Dimension:
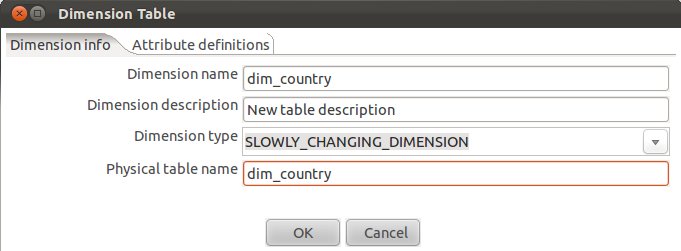
Define the following (Make sure you choose SLOWLY_CHANGING_DIMENSION for Dimension Type):
Next click on the Attributes definitions tab and click on Add default dimension fields: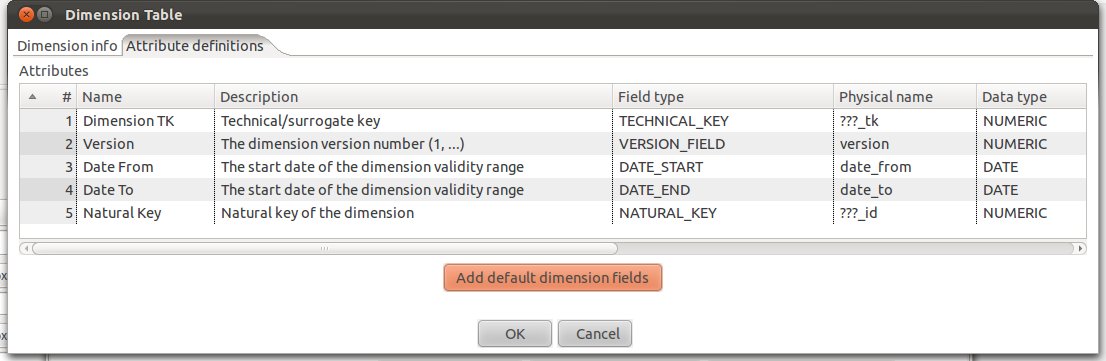
If you are familiar with Ralph Kimball’s slowly changing dimensions, you will realize that PDI makes really good suggestions. Just change:
It should look then like this:
Click OK.
Add an additional attribute called revenue, provide the details as shown below (make sure you also specify the source):
Our fact table is now properly defined.
Click on the Start model info tab and you will now see a simple graphical representation of our star model:
Click OK.

Tutorial Details
- Software (this tutorial was published on 2011-11-04 and download sources were correct on this date but might change in future):
- Download the latest version of PDI which includes the Star Modeler plugin (download here). If you run pdi-ce-4.3.0-M1, you can download the Star Modeler plug-in from here. Ideally though, just download the latest version of PDI.
- MySQL or similar database
- Star Schema file produced in this tutorial (download here)
- Knowledge: Intermediate (To follow this tutorial you should have good knowledge of the software and hence not every single step will be described)
Introduction
Matt Casters, lead developer of PDI, presented a new feature this week for modeling star schemata within PDI. It’s in the very early stages, but already showing huge potential and this is the reason why I thought I prepare a quick tutorial about it.Now why is this new feature so noteworthy:
- You can create your star schema model within the same interface as you create your ETL process, report models, analyzer models and which allows you to analyze your data as well. So, now it’s really like a start-to-finish environment.
- Other features can make use of the metadata you specified within the Star Modeler plug-in! In fact, one button click and PDI automatically generates a job which will run the DDL against the target database. Another click, and a simple ETL transformation gets automatically generated to populate your dimensions. You can use the transformation as a starting point and further improve it if necessary. In future you will be also able to auto-generate the reporting (Pentaho Metadata) model and the Mondrian (Pentaho Analysis) model. By how much will this speed up your development process? I would say a lot!
- From my point of view Matt also included some really nifty features, in example, when you specify a table as date dimension, you have the possibility to let PDI auto-generate one for you. The source data to target data mapping is also quite nicely integrated.
Update: The Star Modeler was open sourced and is included in the latest versions of PDI/Kettle. Disregard the paragraph below.
The plug-in architecture of PDI allows to add new features quite easily. The Star Modeler can be downloaded from here (status: 2011-11-04). Unzip the file in the PDI plug-ins folder and (re)start Spoon. The Star Modeler will now show up as an additional perspective on the top right hand side.
Note: As said, this feature is still in development, so not everything might work as expected.
Getting Ready
Let’s create our source tables, so that we have some data to work with. Run the following SQL statements in your favourite SQL client:CREATE SCHEMA
source_db
;
USE
source_db
;
CREATE TABLE
revenue
(
date DATE,
country_iso_code VARCHAR(3),
revenue DECIMAL
)
;
INSERT INTO
revenue
VALUES
('2011-11-01','GB',22314),
('2011-11-02','GB',23411),
('2011-11-03','GB',22325),
('2011-11-04','GB',22233),
('2011-11-01','US',32423),
('2011-11-02','US',25325),
('2011-11-03','US',43523),
('2011-11-04','US',23453)
;
CREATE TABLE
Countries
(
country_iso_code VARCHAR(3),
country_name VARCHAR(100)
)
;
INSERT INTO
Countries
VALUES
('GB','United Kingdom'),
('US','United States of America')
;
Now let’s create our target database:
CREATE SCHEMA
target_db
;
Our aim is to create this rather simple star schema:
Defining Database Connection Details
Start Spoon. Currently the Star Modeler sources database information from the shared.xml file. So if you haven’t locally share any of your database details yet, create an empty transformation and specify two database connection:- source_db
- target_db
Click on the View tab and right click on Database Connections. Click on New then. Fill out all the details for both connections.
Once done, right click on them and choose Share:
Note: There will be a better way to define database connection details to be used with the Star Modeler in future.
Save your transformation.
How to Create a Star Model
Now that we have the connection details defined, let’s click on the Star Models perspective in the right top hand side corner:
You will be greeted by a blank screen. Now click on the New icon and choose Star Model:
Give the star model a name and description. Then choose target_db as our target database.
Click on Create New Model and fill out the form as shown below:
Creating Dimensions
Next click on the Dimensions tab and click on New Dimension:Let’s create our date dimension: Fill out as shown below. Make sure that you choose DATE as Dimension Type.
Now click on the Attributes definitions tab and then on Add default dimension fields:
You will realize that PDI proposes a quite complete date dimension structure out-of-the-box. What a time saver! We are for now quite happy with this (if you want, you can change this), and click on OK.
So we have now defined our date dimension. Let’s go ahead and work on our country dimension:
Click on New Dimension:
Define the following (Make sure you choose SLOWLY_CHANGING_DIMENSION for Dimension Type):
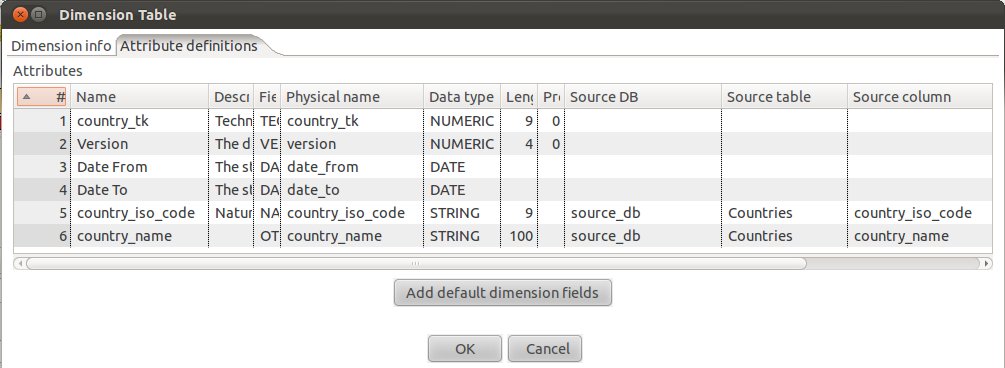
Next click on the Attributes definitions tab and click on Add default dimension fields:
If you are familiar with Ralph Kimball’s slowly changing dimensions, you will realize that PDI makes really good suggestions. Just change:
- the Physical names (replace the ??? with real names)
- the natural key to country_iso_code (data type: string) and add country_name as additional attributes.
- specify the Source DB, Source table and Source column for country_iso_code and country_name.
It should look then like this:
Click OK.
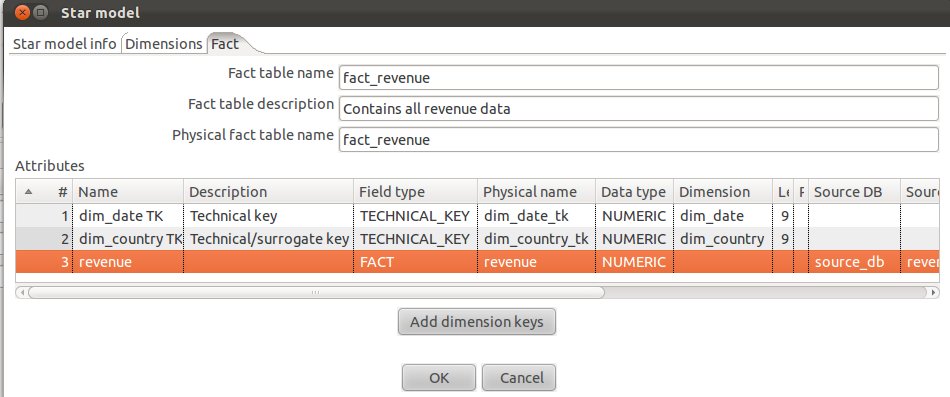
Creating a Fact Table
In the Star Model window click on the Fact tab and click on Add dimension keys. Now PDI automatically insert the technical keys of the dimensions we defined before.Add an additional attribute called revenue, provide the details as shown below (make sure you also specify the source):
Our fact table is now properly defined.
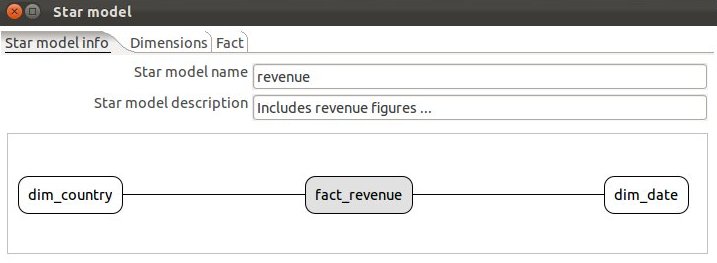
Click on the Start model info tab and you will now see a simple graphical representation of our star model:
Click OK.
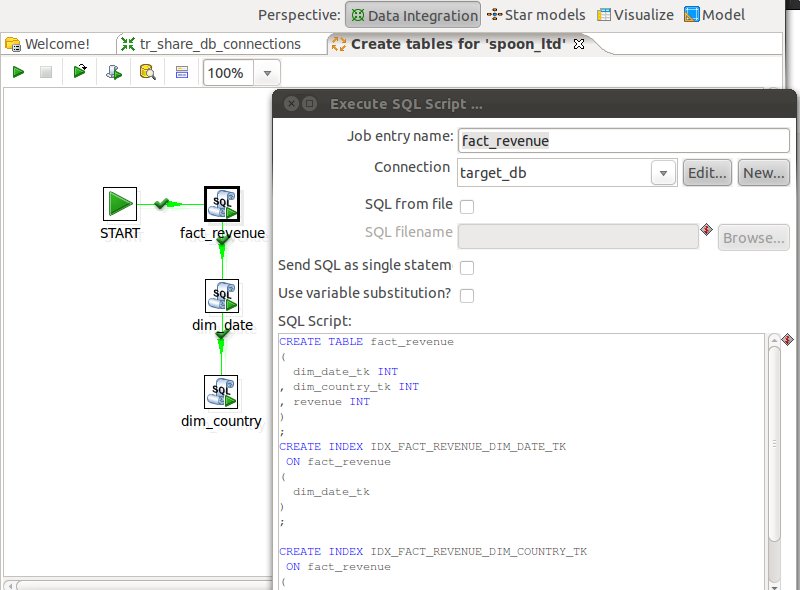
Automatic Generation Features
Now that our star model is defined, PDI gives us the option to automatically generate the following by just the click on a button:SQL DDL Job
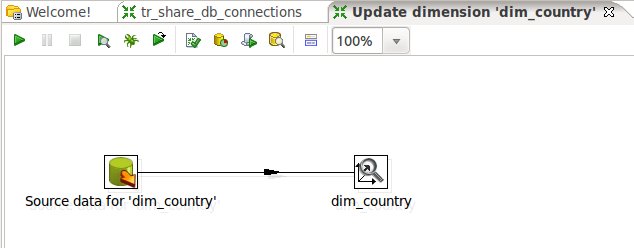
This job will allow you to automatically create the DDL for the target database. Just click on SQL Job and a second later you will see a job like this:Update Dimensions (Domain Job)
By clicking on Domain Job PDI will generate a simple transformation to update your dimensions:Pentaho Metadata Model (Physical Model)
This feature is currently under development.Pentaho Analyzer Model (Mondrian Schema)
This feature is currently under development.Documentation
This feature is currently under development.Conclusion
I hope that this simple tutorial demonstrated the huge potential of this new feature. It will certainly get better and better over time, so watch the space!Saturday, July 30, 2011
Pentaho Data Integration 4 Cookbook - Book Review
Book Review: Pentaho Data Integration 4 Cookbook
Pentaho Data Integration 4 Cookbook by María Carina Roldan and Adrián Sergio Pulvirenti illustrates with plenty examples how data can be imported from various sources, transformed and exported to various sources with the open source tool Kettle (Pentaho Data Integration). It's all a hands-down approach: Follow the step by step guide of the examples and you will have the right knowledge at the end of the book to create your own data integration solutions. The book is easy to read even for novices and offers a great introduction to the world of Pentaho Kettle.
In times of economic downturn and an extremely competitive market companies are trying to save money where ever possible. In the last few years we have seen a trend towards open source business intelligence solutions. The quality and functionality of open source business intelligence tools has increased over time as well and nowadays they are a very convincing alternative to very costly commercial business intelligence solutions.
For a lot of open source business intelligence tools, documentation has been a weak point in the past. Some products have a really strong community following and maybe a Wiki, which were often you main source of information. In the last 2 years this situation changed: There are now some publications available that cover some of these open source business intelligence packages, one of the very recent one being Pentaho Data Integration 4 Cookbook by María Carina Roldan and Adrián Sergio Pulvirenti.
Data Integration (ETL, short for extract, transform, load data) is one of the most important building blocks of a business intelligence solution. You can have the fanciest dashboards and reports, but if you don't have the correct data for them, they are pretty useless. ETL involves sourcing that data from a database, text file, Excel spreadsheet etc, transforming the data and outputting it to any convenient file format or database. Most ETL tools offer a graphical user interface which allows you to create data flows. The beauty of this is that there is hardly any coding involved, it is easy to understand (as you are looking at a flow diagram) and you are working quicker as well (you are not coding everything). Nowadays, the probably two most popular open source ETL tools are Pentaho Data Integration and Talend.
Pentaho Data Integration 4 Cookbook is an ideal book for somebody who looks for a hands-down tutorial-style book. It is filled with an abundance of examples and you can download the accompanying files from the dedicated website as well. Now what does this book cover:
The first chapter is all about how to get data from databases, parameterizing SQL queries and updating/deleting records from database tables. Especially interesting is the section about using parameters with your SQL query to dynamically source your data. The authors also explain how you can generate primary key values for your dataset in Kettle in case your database table requires them.
The second chapter focuses on getting data from text files. Rich examples are provided to handle structured as well as instructed text files. Especially the section about working with various forms of unstructured text files is really informative. The last section of the chapter is all about retrieving data from Excel spreadsheets. Chapter 3 focuses on working with XML files: Kettle offers features to read, validate and generate XML documents.
Kettle is not only an ETL tool, but also offers workflow management as well: This book gives a good overview on how to create jobs, which allow to run transformations and other tasks (e.g. send email email notifications, create folders, check if a file exists, etc) in sequential order. File management is covered next, which looks at copying, moving and deleting files and folders. Once you imported the data, you also might have to look up some additional data from other sources, so chapter 5 gives you a good overview on this topic. There is really one nifty example: It is about transforming data about museums and looking about the opening hours by using a web service.
Up next: Learn how to split, merge and compare data streams. Chapter 7 shows you how to execute and reuse jobs and transformations. Then it's all about how you can integrate your Kettle ETL processes with the other Pentaho products (Business Intelligence Server, Report Designer, Dashboards etc). The final chapter learns you the tricks on how get the most out of Kettle.
All in all, this book is in excellent read for somebody who wants to have a quick start in open source ETL process design. The book is fully based on examples, which explained in an easy to understand language. There are many illustrations as well and at the end of each example you will find a summary and sometimes hints on where to find more info. This book is ideal for somebody who wants to get up and running with this popular open source ETL tool in a short amount of time. If you interested in this book, you can get it directly from here.
Subscribe to:
Comments (Atom)