Friday, January 18, 2013

Mondrian 4: Get ready!


Mondrian 4: Get ready!

Mondrian is a very popular open source analytical engine which is used in various offerings (like Pentaho BA Server, JasperSoft BI Server). Mondrian 4 brings a whole bunch of new features, some of which we will discuss in this blog post.

Prerequisite


  • You are familiar with XML
  • You are familiar with OLAP
  • You are familiar with the command line on a Linux OS or Mac OS.
  • Download Eclipse IDE for Java EE Developers from here. Users unfamiliar with Java, don’t worry, we won’t write a single line of Java! We will use Eclipse only to create an OLAP schema.
  • Download the Mondrian 4 version of Saiku from here. We will use it to test the schema. Please note that this branch is in active development and not suitable for production use! If you need a version for production use (currently without Mondrian 4 support), download it from the main website.
  • This post is not really a step by step tutorial, more a kind of general overview, so it is recommended that you have a data set (ideally a data mart) so that you can follow along and create your own OLAP schema.
  • All my files related to this post can be download here.

What’s new

  • Dimensions are now loosely set up using Attributes. The can be part of a hierarchy but they don’t have to. If defined in a hierarchy, they can still be used on their own.
  • MeasureGroups can be used to define Measures from more than one fact table (that have the same dimensionality and granularity).
    • There are no aggregated patterns any more, use MeasureGroups for defining aggregates.
    • Virtual Cubes are depreciated
  • Schema Workbench is discontinued. Write the OLAP Schema in a text/XML editor of your choice
  • No XMLA server, spin off project OLAP4J xmla server
  • Built-in time dimension generator

A quick overview of the new syntax

We will quickly have a high level overview of the new syntax. I highly recommend obtaining the forthcoming book Mondrian In Action for more detailed instructions. Also, if you don’t know the purpose of an XML element or attribute, you can find a description in the Mondrian API documentation.

High level structure

Please find below a simplified structural overview of the OLAP schema definition:

<?xml version="1.0" encoding="UTF-8"?>
<!DOCTYPE Schema SYSTEM "mondrian.dtd" >
<Schema metamodelVersion="4.0">
<!-- Define how the DB tables are set up -->
<PhysicalSchema>
<!-- Specify source tables -->
<Table/>
<!-- Define relationships between snowflake or alias tables, not direct dim tables! -->
<Link/>
</PhysicalSchema>
<!-- Create your cube definition and reference back to the physical schema -->
<Cube>
<!-- Define dimensions and attributes -->
<Dimensions>
<Dimension>
<Attribute/>
</Dimension>
<Hierarchies>
<Hierarchy>
<Level/>
</Hierarchy>
</Hierarchies>
</Dimensions>
<!-- Define Measures -->
<MeasureGroups>
<MeasureGroup>
<Measures>
<Measure/>
</Measures>
<DimensionLinks>
<ForeignKeyLink/>
<FactLink/>
</DimensionLinks>
</MeasureGroup>
</MeasureGroups>
<!-- Define Calculated Members and Names Sets -->
<CalculatedMembers/>
<NamedSets/>
</Cube>
<!-- If you have conformed dimensions, specify them globally.-->
<Dimension>
<!-- Define roles below to restrict access to the cube(s). -->
<Role>
</Schema>

Note that Mondrian 4 is not sensitive to the order you mention these building blocks, so you can mention the cube before the physical schema in example.

How to define the physical schema

The physical schema defines how your database tables are set up:
<PhysicalSchema>
      <Table name='employee'>
          <Key>
              <Column name='employee_id'/>
          </Key>
      </Table>
      <Table name='store'>
          <Key>
              <Column name='store_id'/>
          </Key>
      </Table>
      <Link source='store' target='employee'>
          <ForeignKey>
              <Column name='store_id'/>
          </ForeignKey>
      </Link>
</PhysicalSchema>
Note: The <Link> element is only used to describe the relationship to alias tables or snowflaked tables (so tables that are more than one link away from the fact table).

How to define dimensions

Dimensions are defined with the <Dimension> element and their members with the <Attribute> element. Mondrian will by default create a hierarchy for every attribute you create unless you specify <Attribute hasHierarchy=”false”>. There is an optional <Hiearchy> element for specifying multi-level hierarchies.

          <Dimension name='Promotion' table='promotion' key='Promotion Id'>
              <Attributes>
                  <Attribute name='Promotion Id' keyColumn='promotion_id' hasHierarchy='false'/>
                  <Attribute name='Promotion Name' keyColumn='promotion_name' hasHierarchy='false'/>
                  <Attribute name='Media Type' keyColumn='media_type' hierarchyAllMemberName='All Media' hasHierarchy='false'/>
              </Attributes>
              <Hierarchies>
                  <Hierarchy name='Media Type' allMemberName='All Media'>
                      <Level attribute='Media Type'/>
                  </Hierarchy>
                  <Hierarchy name='Promotions' allMemberName='All Promotions'>
                      <Level attribute='Promotion Name'/>
                  </Hierarchy>
              </Hierarchies>
          </Dimension>


One of the big advantages of Mondrian 4 is that you can now use attribute on their own as well even if they are part of a mulitlevel hierarchy!

How to define measures

Measures are defined with a <MeasureGroup> element. Within the <DimensionLinks> element you can define the foreign keys for all the dimensions that are related to this MeasureGroup:
<MeasureGroups>
          <MeasureGroup name='Sales' table='sales_fact_1997'>
              <Measures>
                  <Measure name='Unit Sales' column='unit_sales' aggregator='sum' formatString='Standard'/>
                  <Measure name='Store Cost' column='store_cost' aggregator='sum' formatString='#,###.00'/>
                  <Measure name='Store Sales' column='store_sales' aggregator='sum' formatString='#,###.00'/>
                  <Measure name='Sales Count' column='product_id' aggregator='count' formatString='#,###'/>
                  <Measure name='Customer Count' column='customer_id' aggregator='distinct-count' formatString='#,###'/>
                  <Measure name='Promotion Sales' column='promotion_sales' aggregator='sum' formatString='#,###.00' datatype='Numeric'/>
              </Measures>
              <DimensionLinks>
                  <ForeignKeyLink dimension='Store' foreignKeyColumn='store_id'/>
                  <ForeignKeyLink dimension='Time' foreignKeyColumn='time_id'/>
                  <ForeignKeyLink dimension='Product' foreignKeyColumn='product_id'/>
                  <ForeignKeyLink dimension='Promotion' foreignKeyColumn='promotion_id'/>
                  <ForeignKeyLink dimension='Customer' foreignKeyColumn='customer_id'/>
              </DimensionLinks>
          </MeasureGroup>
</MeasureGroups>

How to define aggregated tables

In previous versions configuring aggregated tables was an area of confusion for many users. Thankfully this has been massively simplified with the arrival of Mondrian 4. Now aggregated tables can be directly referenced in the OLAP schema inside the <PhysicalSchema> and properly defined inside the <MeasureGroup> element.

<PhysicalSchema>

<Table name='agg_c_special_sales_fact_1997'/>
<Table name='agg_pl_01_sales_fact_1997'/>
<Table name='agg_l_05_sales_fact_1997'/>
<Table name='agg_g_ms_pcat_sales_fact_1997'/>
<Table name='agg_c_14_sales_fact_1997'/>
</PhysicalSchema>

<MeasureGroups>
 …
          <MeasureGroup table='agg_c_special_sales_fact_1997' type='aggregate'>
              <Measures>
                  <MeasureRef name='Fact Count' aggColumn='fact_count'/>
                  <MeasureRef name='Unit Sales' aggColumn='unit_sales_sum'/>
                  <MeasureRef name='Store Cost' aggColumn='store_cost_sum'/>
                  <MeasureRef name='Store Sales' aggColumn='store_sales_sum'/>
              </Measures>
              <DimensionLinks>
                  <ForeignKeyLink dimension='Store' foreignKeyColumn='store_id'/>
                  <ForeignKeyLink dimension='Product' foreignKeyColumn='product_id'/>
                  <ForeignKeyLink dimension='Promotion' foreignKeyColumn='promotion_id'/>
                  <ForeignKeyLink dimension='Customer' foreignKeyColumn='customer_id'/>
                  <CopyLink dimension='Time' attribute='Month'>
                      <Column aggColumn='time_year' table='time_by_day' name='the_year'/>
                      <Column aggColumn='time_quarter' table='time_by_day' name='quarter'/>
                      <Column aggColumn='time_month' table='time_by_day' name='month_of_year'/>
                  </CopyLink>
              </DimensionLinks>
          </MeasureGroup>
</MeasureGroups>

Creating an OLAP Schema in Eclipse

You can create the Mondrian OLAP Schema in any text editor, XML editor or IDE. Eclipse is quite a popular IDE and will serve as an example here.

I created an XSD based on the DTD file found in the Mondrian lib folder (Link to original Mondrian 4 DTD) to be able to validate the XML file (the actual OLAP Schema). Currently this DTD is not suitable for validating the OLAP schema XML document (Julian pointed at that he added multiple inheritance to the schema. He created this JIRA case to address this). So, what I basically did, and this was a very quick fix, is to run the DTD through a converted that outputs an XSD and then I quickly fixed the few problems I encountered. I tested this XSD against one of my XML files and against the Foodmart one which worked fine. I am sure that this schema (XSD) needs some more work, so please report back to me any problems that you encounter using the comment function on this post.

Download my Mondrian XSD version mondria4.xsd here.

Please don’t get confused: The XSD (short for XML Schema Definition) is a file which defines the structure of an XML document. XSD is a successor of DTD (Document Type Definition) and is way more powerful. The XML document (which we will create based on this XSD) in our case happens to be called the Mondrian OLAP Schema (I will try to mostly call it XML file).
Open Eclipse and create a new Project (not a Java Project) called Mondrian4Schema. Place the XSD file directly in the project folder.
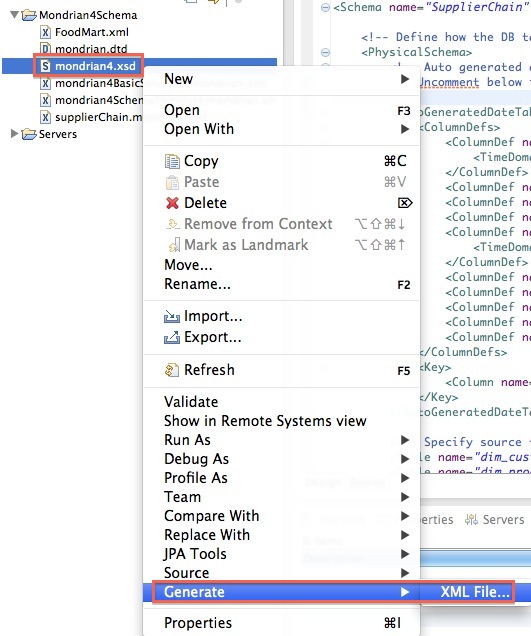
The easiest way to create the XML file is to right click on the XSD file and choose Generate > XML File:

Next specify the Root element, which in our case is Schema:


A basic XML structure will be created for you. People familiar with XML will probably want to jump directly to the source view and start working there.

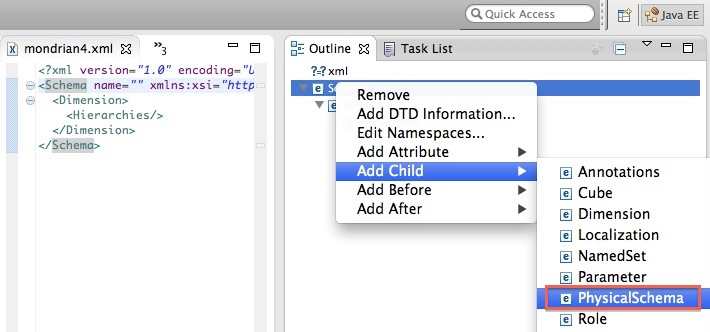
For people not so familiar with XML, you can use the Outline panel to add elements and attributes by simply right clicking on a node:

And before you upload the xml file to the server, you should validate it. Right click on the xml file and choose Validate:


Note: This validation only checks if your XML file matches the structure define in the XSD file. So it doesn’t check if you referenced the correct tables, if the relationships are correct etc. We can call this our first check. The second check will be to understand if the xml file is logically correct - this will be done by running it on Mondrian (i.e. via Saiku) and analyzing the error messages (if there are any). The third check is then to see if the data is correct / dimensions and measures behave as expected - test this via a graphical interface like Saiku.

Using an XML Template in Eclipse

To make your life even easier, start your OLAP schema based on a template. I created a template which you can download here and use for the following steps. You can also create your own one.

Note that the sample template expects the XSD file to be in the same folder as the xml file you create. You can easily avoid this dependency by pointing to a public XSD.

Copy the content of the template file.

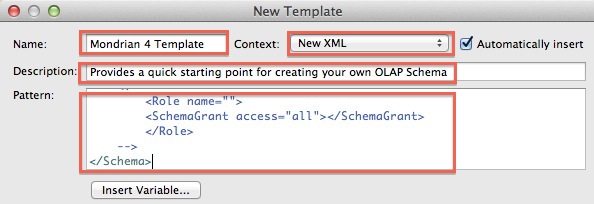
Go to Preferences  and select XML > XML Files > Editor > Templates and then click New:
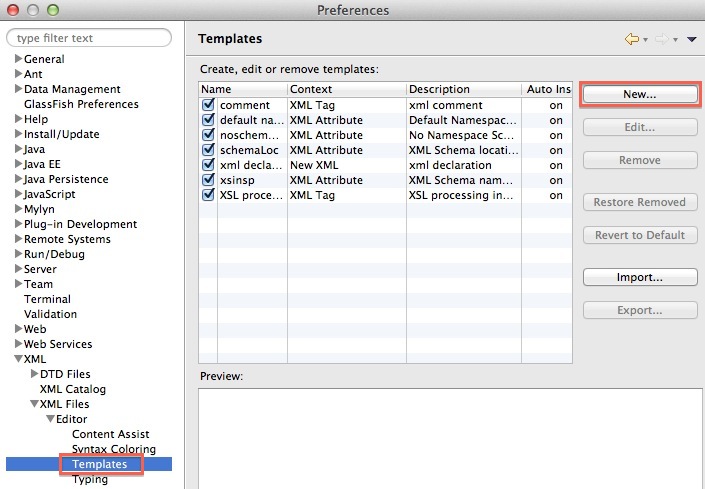

Provide a Name and Description. Set the Context to New XML and paste the content of our template into Pattern:

Click Finish.

Now, when you create a new XML File, you can choose Create XML file from an XML template:
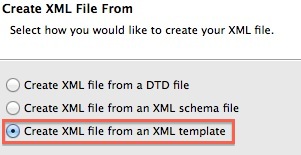

And then you can choose the template we set up earlier:


Using a template should save you quite some time and users unfamiliar with Mondrian schemas will have an easier entry point.

How to upload the OLAP Schema to the BI Server

Schema Workbench had the quite useful option to upload the XML file to the BI Server. There are plenty of alternatives now … you might as well use Filezilla or a similar FTP client to upload the file to a remote server. Later on I will show you how you can export your XML file directly from Eclipse to your local webserver.

Testing Mondrian 4 Schema with Saiku locally


Setting up Saiku

Current download location of the Mondrian 4 version (2013-01-14):
http://ci.analytical-labs.com/job/saiku-mondrian4/

If you have the Pentaho BI Server installed, then you can just download the plugin. Otherwise if you want to have the standalone version, download Saiku Server.

Instruction below are for the standalone Saiku Server:
If you are not familiar with the Saiku Server, then read this short introduction.

I extracted the files in my home folder. Let’s get ready and start the server:

cd ~/saiku-server
chmod -R 700 *.sh
sh ./start-saiku.sh

Wait a minute or so until the server is ready, then check if you can access it in your browser:

http://localhost:8080
username: admin
password: admin

If you can access the web interface, carry on with the following steps:

Export the Mondrian XML file to your local test server

We could have created a Dynamic Web Project in Eclipse as well and deployed it on the server, but this is probably a bit too ambitious. It is very simple to export to xml file to the server from our Eclipse project.

First let’s create a folder on the server. There is currently a folder set up for all the Saiku demo files - we will be using this one for simplicity sake:
cd ~/saiku-server/tomcat/webapps/saiku
mkdir supplierChain

In Eclipse, right click on the Mondrian xml file, choose Export:
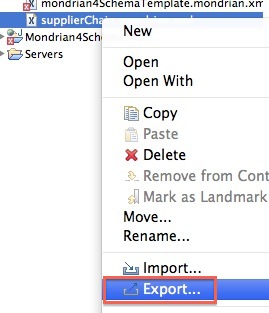
Next choose General > File System and click Next:

Define which file from which project you want to export and define the destination folder:

And click Finish. Now you have a copy of your file on your local server.

Configuring Saiku

Configure the data source as described here.
If necessary, add a JDBC driver as described here.
In my case, this burns down to the following (as an example my DB tables reside on my local MySQL DB and I created a Mondrian schema called supplierChain.mondrian.xml):

cd ~/saiku-server/tomcat/webapps/saiku/WEB-INF/classes/saiku-datasources
cp foodmart supplierChain
vi supplierChain

Change the content of the file to:

type=OLAP
name=supplierChain
driver=mondrian.olap4j.MondrianOlap4jDriver
location=jdbc:mondrian:Jdbc=jdbc:mysql://localhost/datamart_demo;Catalog=../webapps/saiku/supplierChain/supplierChain.mondrian.xml;JdbcDrivers=com.mysql.jdbc.Driver;
username=root
password=

Save and close.

Note: In my download the Saiku Server had already the MySQL JDBC jar included, so the next section is just an overview in case you need to add any other driver

Next download the JDBC MySQL driver from here.

cd ~/saiku-server/tomcat/webapps/saiku/WEB-INF/lib/
cp ~/Downloads/mysql-connector-java-5.1.22/mysql-connector-java-5.1.18-bin.jar .

Nice and easy.

Restart Saiku and check if you can see the schema now in the web interface:

If you encounter problems, have a look at the server log:
vi ~/saiku-server/tomcat/logs/catalina.out
Go straight to the end of the file by pressing SHIFT+G and then start scrolling up and keep looking out for human readable error messages. Note at new users: There will be a lot of cryptic lines … just ignore them … at some point you should find something meaningful (if there is an error).
Or if you want to keep watching the log:
tail -f ~/saiku-server/tomcat/logs/catalina.out
In case there are problems with your OLAP schema, you should find some hints there.

Example of which errors you can find via reading the weblog: My new OLAP schema was not showing up in the web interface, so I analyzed the log and found the following line:

As you can see, it says here “Table 'dim_customers' does not exist in database. (in Table) (at line 27, column 4)”, which means the table name I specified in the XML file must be wrong. Doing a double check I realised, the table is actually named dim_customer. So I go back to Eclipse, correct this mistake, reupload the file and refresh the cache again … now my Schema is showing up.


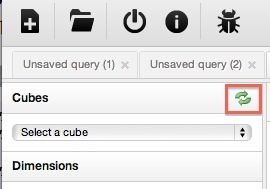
If you make changes to the Schema and export it to the server again, you can simply refresh the Saiku server cash by clicking the Refresh button in the web interface:
Now we can do the last part of our checks: Analyzing if the dimensions and measures behave as intended and as we are already on the way, we also check if the data is correct. We do all this by just playing around with the dimensions and measures in the GUI and also run some SQL queries to cross check results:

How to enable Mondrian MDX and SQL logging on Saiku

In some testing scenarios you might be interested in the SQL that Mondrian generates. To enable this kind of logging, edit the log4j.xml file in
~saiku-server/tomcat/webapps/saiku/WEB-INF/classes

Uncomment the very last section just below the title Special Log File specifically for Mondrian SQL Statements. If you want to log the MDX statements as well that gets submitted, uncomment the section above (Special Log File specifically for Mondrian MDX Statements). Save the file.

Restart the server then.

You will then find two new log files in ~/saiku-server/tomcat/logs:
mondrian_sql.log
mondrian_mdx.log

In example, if you use the fancy MDX mode functionality on Saiku which allows you to write and execute your own MDX queries, you can just follow the SQL which gets generated by Mondrian by running this command in your terminal:
tail -f ~saiku-server/tomcat/logs/mondrian_sql.log

Tuesday, November 20, 2012

Database Version Control: Sooner than later! (NeXtep)

Working in business intelligence usually involves creating schemas for at least the data warehouse and data marts. Usually the DDL is written using a text editor or some kind of GUI, svn or git or similar is used as standard version control, but effective versioning of this ddl is quite often not happening. Why do I say “effective” versioning - well in the case of database development you will need a tool that can generate the DDL for the delta of two versions, so that you can easily upgrade your databases.
If you are working in a project which involves properly set up development, testing and production environments, database version control should be mandatory. The good news is that there are actually some open source tools out there which can help you with that. The bad news is, that none of them can be considered in active development and none of them probably found the recognition and widespread usage that their original developers set out for.
About a year ago I tried to find some open source projects for database version control, the two tools I could find at that time were dbmaintain and neXtep. Judging by their release history one might think that these projects are dormant. So I kind of gave up on this topic. This year then at the Pentaho User Meeting in Amsterdam Edwin Weber actually mentioned neXtep in his presentation and I had a brief conversation with him afterwards about his experience with this particular tool. He mentioned that although there were no new releases, there were still patches submitted for that tool. So I kind of thought, let’s give this a try. I finally came around to take a look at neXtep just a week ago.
After registering you can download the neXtep Studio, which is Eclipse based. Setting it up is fairly straightforward and the interface is fairly intuitive as well. What I was not expecting is that the documentation was that good. It seems like the people behind this project spent really a considerable amount of time in creating what I would call an excellent documentation, which you can find here.
There is also a forum where I even got some answers to my questions! If someone fancies adding support for additional databases, some documentation can be found here and here.
The aim of this post is not to walk you through the tool, as their Wiki really is the best place to find that insight, it is just a way of saying: “Hey, there is this impressive tool out there for database version control, start using it and give them some support!”.
I think, that, although it is very often neglected, database version control is a very important topic. Version your database sooner than later!

Some notes on the installation:
I had some problems with setting up the neXtep repository on

  • PostgreSQL 9.2: Two columns could not be created. See here on how to solve this problem.
  • MySQL 5.5: The installer started hanging when performing the final upgrade of the repository. I just killed the process and started neXtep Studio again after which it successfully upgraded the repository. I couldn’t create any user then, but luckily (in this case) the password is stored as plain text in the db table. Run:
    SELECT * FROM nextep_repo.REP_USERS;


How to use neXtep’s database version control

This is an extremely simplified setup: Let’s imagine we already have one table in our PostgreSQL database (users with MySQL, MS SQL or Oracle databases please adjust the SQL respectively):

CREATE DATABASE nextep;
\connect nextep
CREATE SCHEMA test;
CREATE TABLE
test.user
(
firstname VARCHAR(50)
, lastname VARCHAR(50)
)
;

We decide to start with database version control, because things are going to get much more complex pretty soon once the project starts rolling.
On the terminal (in my case on Ubuntu) navigate to the neXtep install directory and start the Studio (this takes into account that you have already set up the neXtep repository and users):

./neXtep

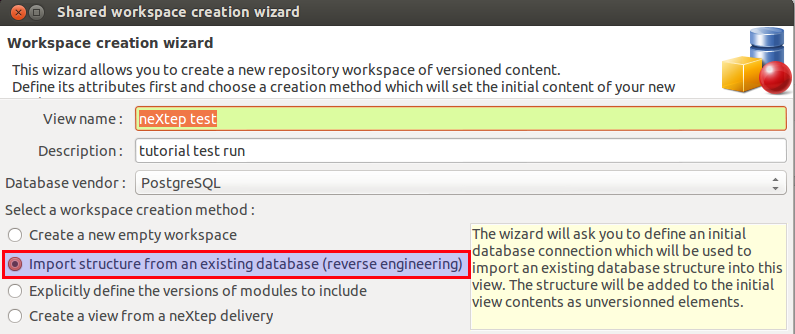
When the Shared Workspace selection dialog comes up, choose New Workspace. Then provide a name, description and select PostgreSQL as database vendor. Make sure you then select Import structure from an existing database (reverse engineering):

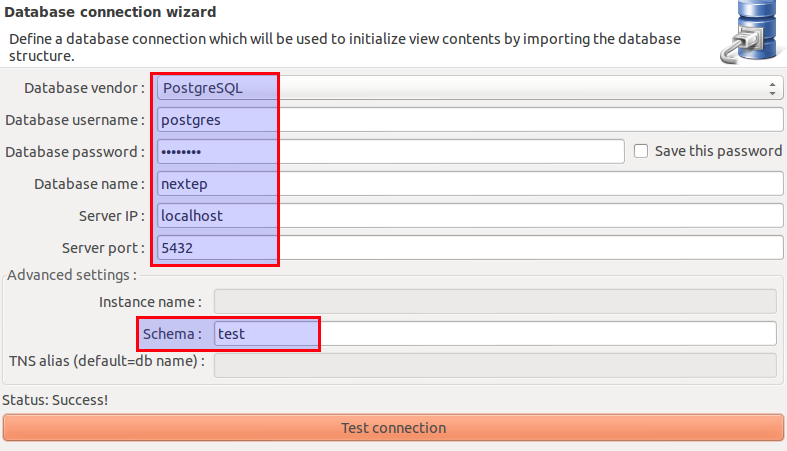
Now provide all the database connection details and test the connection:

Click Next. You will be asked to for the DB password again (make sure you tick to save it this time).
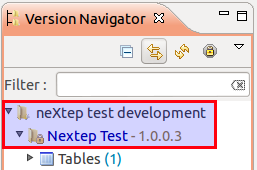
Now pay special attention to the Version Navigator on the left hand side of the Studio:

Right click on the module, the second element in the hierarchy, Nextep Test, and choose commit:

In this case we will not change the version number (but we will do so in future). Add a good description and then click commit. Now you will see that module as well as the table name have a lock symbol attached.

Next mark the table name and click on the Check Out button (or alternatively right click on the table name and choose Check Out):

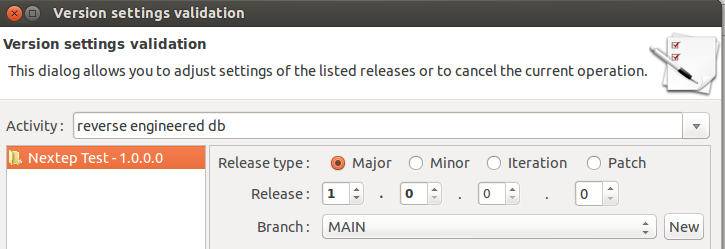
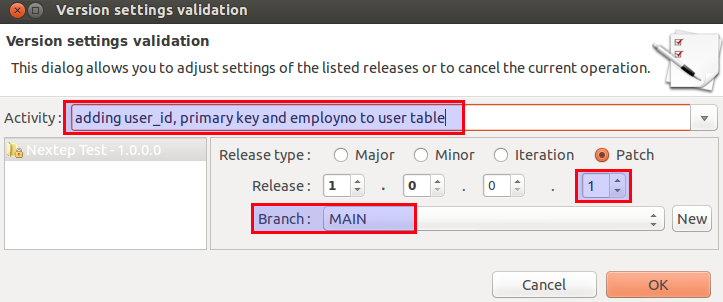
A new dialog comes up, called Problem Solver Wizard, just click Finish. Next provide a good description of the changes you are about to make. You will see that neXtep automatically increase the patch number, which is just what we want in this case. We also want to work on the main branch:

Click Ok.
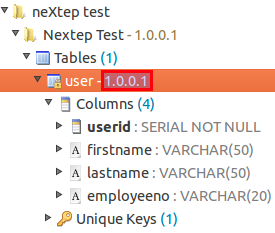
Notice that the lock symbols disappeared in the Version Navigator and that the version number increased.

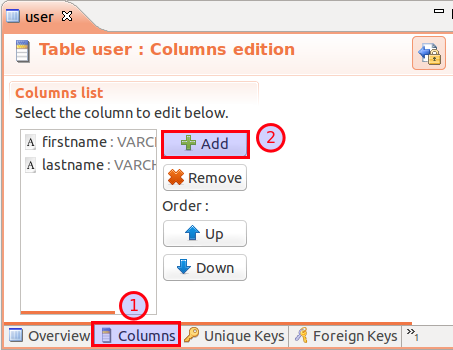
In the Version Navigator double click on the user table. You will now see a new Table Overview coming up. Let’s now add a new column called user_id. Click on the Columns tab at the bottom of the Table Overview, then click on Add:


Add following columns:

  • userid: SERIAL
  • employeeno: VARCHAR(20); description: alpanumeric code
Next move the userid column up so that it is the first column in the table.

Click on the Primary Keys tab and a new primary key called PK_userid and assign the userid column:

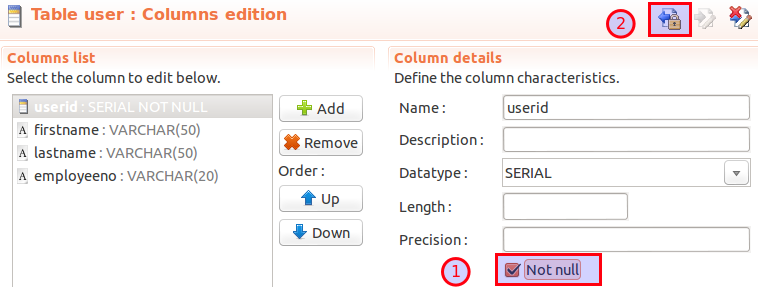
We also want to pay attention on the error message neXtep brought up: We forgot to define the userid column as NOT NULL, so we go right back to the Columns tab and change the userid accordingly:

As we have implemented all the required changes, we are ready to commit them. Click on the Commit and lock this version button. You have now one more time the chance to adjust the description, then click commit.
Note that the version number increased again:

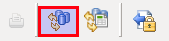
Then click on the Synchronize DB button:

This opens the Synchronization perspective.
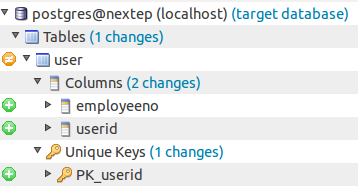
The Synchronization pane gives you an exact overview of the changed since the last applied version:

It highlights that we added the employeeno and userid columns as well as a primary key called PK_userid.
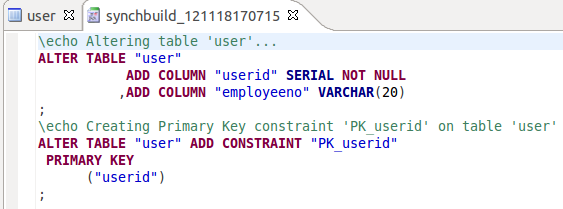
In the main work area you can see the DDL neXtep generated to upgrade our target database from version 1.0.0.0 to 1.0.0.1:

As this looks all quite fine for us, we click on the Execute button:

And all these changes will be applied to our target database. Watch the Console view for any progress messages.

It’s always good practice to click the Synchronize button again just to make sure that our model matches the DB model. As we can see in our case, something is not quite alright:

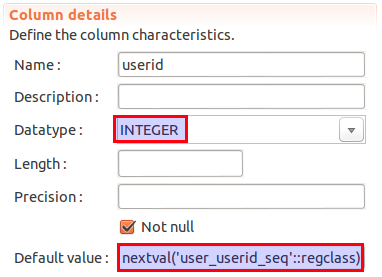
What basically happened is that PostgreSQL created its own sequence for the userid and also changed the data type to Integer. This is fine for us, so we can just incorporate these changes. Click on the Repository reverse synchronization from database information button and then click Execute:

Now we want to ensure that everything is properly in sync again, so we click the Synchronize database button again. Now everything is fine (click the Shows/Hides unchanged items button as well):

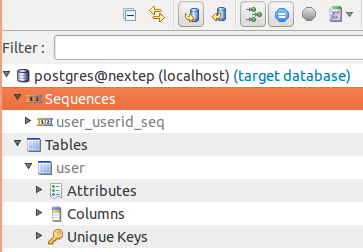
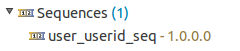
Go back to the Database Design perspective and have a look if the changes were applied. We can see that a new sequence was added (in the Version Navigator)

and that the userid column details changed:

To be fair, we could have set it up like this in the first place, but now at least you got a bit more exposed to the synchronization options.

How to create a branch

This is now our first release, which will be delivered to the test environment. Let’s create a new branch test to commit these changes there:
Click on the module Nextep Test and choose Commit. Provide an activity description and click on Iteration. Then click on new and create a Test branch:

Click Next followed by Finish.

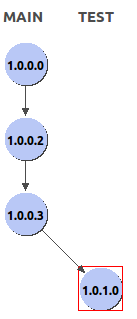
Note that the version tree gets automatically updated:


We could now package and deliver this model (available via a right click action on the module name). neXtep also supplies a command line tool called neXtep Installer (more info here) which is able to deploy database deliveries generated by the neXtep Studio.

How to merge

Obviously we also want to have all these improvements in the main branch, so we can use the merge action. First we have to go back to the last version of the MAIN trunk. We do this by creating a new workspace.

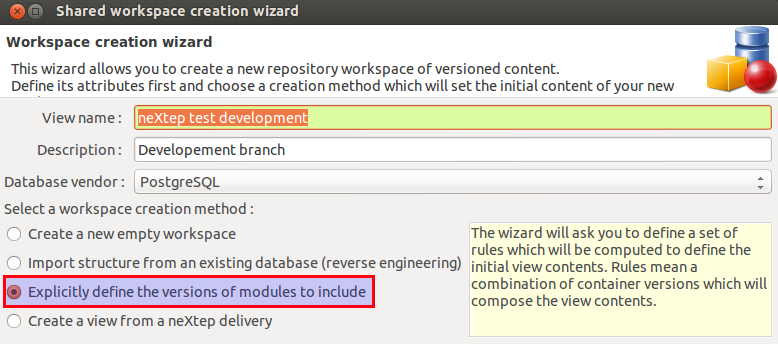
Choose Workspace > Create new workspace and make sure you select the Explicitly define the versions of the modules option.

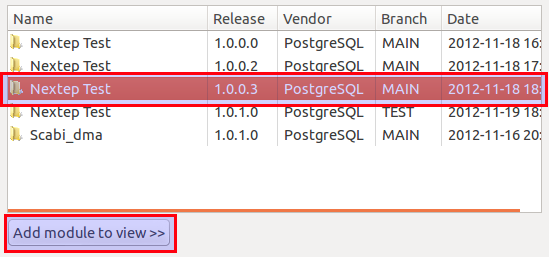
In the View rules definition wizard choose the latest version of the main trunk and click Add module to view:


Click Finish.

As you can see in the Version Navigator our new workspace is based on the latest main trunk version:


If you now click on Workspace > Change Workspace you will see that you can now switch between the main and test trunk versions by switching between these two workspaces (ok, we should have named it in a better fashion):


Workspace: Versions are not bound to a particular workspace. A workspace is just a space where you define the set of elements you need to work on, and you can create as many workspaces as you need. [source: neXtep site]

Click on Cancel.

Now we want to merge the latest version of the Test branch with this one, so that we have all the changes over here for a good base to add future developments:

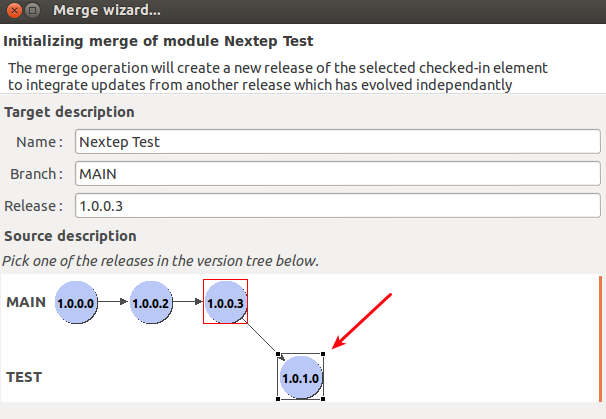
Right click on the module Nextep Test and choose Merge to ..., which brings up the Merge Wizard. Click on the latest version of the Test branch in the diagram:

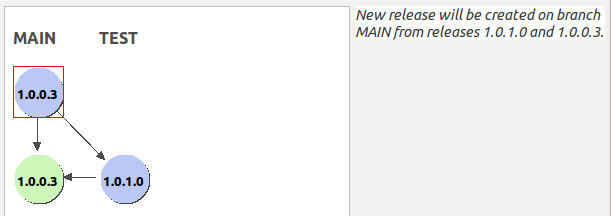
Click Next and you will see a graphical representation of the changes you requested:

Now you will see a detailed overview of the merge results (note that the screenshot might not 100% match with yours because I added a few other things, but you get the idea):


Click Ok.

Summary

We walked through various scenarios that you might come across in your daily work with database versioning - like creating dedicated branches, merging branches. As you have seen neXtep Studio is an extremely promising open source product! Database versioning is extremely important, so start today with it! You will not look back!

Friday, November 9, 2012

Stylesheets with Pentaho Report Designer


Stylesheets with Pentaho Report Designer

Stylesheets are the second big feature being integrated into PRD this year (the other one being crosstabs). I submitted a feature request for stylesheets some months ago (PRD-3823, PRD3834), simply because working on big projects requires stylesheets: You don’t want to waste hours changing every single report in case your client wants to have a style amended; you don’t want to recreate styles over and over again when you create new reports etc. I did not expect this feature to arrive anytime soon, so, quite surprisingly, as of today they are available in the latest trunk snapshot even with full CSS3 support (download here) (posted by Thomas here)! My very simple sample report can be downloaded here.
It is possible to store styles internally or externally. External stylesheets will have the extension .prptstyle.
To me stylesheets are an import part of report design and I am sure many other users will welcome this new feature. So let’s have a look at how to create and use stylesheets in PRD:

Once you have the trunk snapshot downloaded (note: do not use for production!) open PRD and create a new report, add a query and a few fields:


How to create internal styles

If you want to use internal styles, choose Format > Edit Style Definition.

This option is only useful when you intend to create a specific design for one specific report. I highly recommend you make use of an external stylesheet for bigger projects, which we will discuss next.

How to create an external stylesheet

In this case we want to create an external stylesheet, choose Window > Style Definition Editor

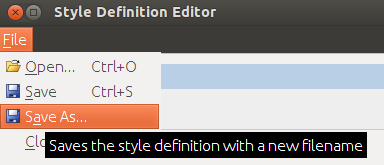
Make sure you save the external stylesheet straight away and while you are working:


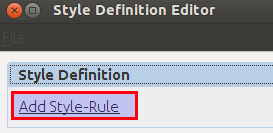
Add a new style rule:


Note: The name of the style-rule is very important, it’s not just an arbitrary name!

Examples:

Style Rule NameExplanation
label[name="title"]The style will be automatically applied to all labels with the name title. The title for the label element can be defined in the Attributes pane:
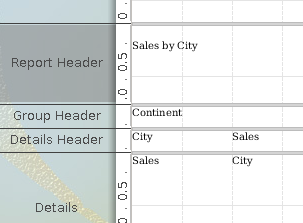
group-header label[name="title"]This style will only be applied to a label with the name title in the group header.
report-header band[name=”subtitle”] labelThis style will only be applied to a label which is located in the band of the subtitle.
details-header labelThis style will be applied to all labels in the details header
itemband text-fieldThis style will be applied to all text fields in the details band
number-field[field="Sales"]This style will be applied to all number-fields which represent the data field Sales:
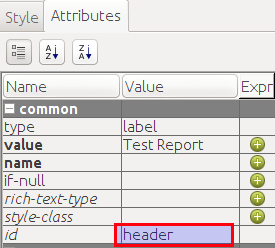
#headerThis CSS id selector style (more info here) will be applied to a unique element with the id in the Attributes pane set to ‘header’:
Note: Do not prefix the id with a # in the attribute value!
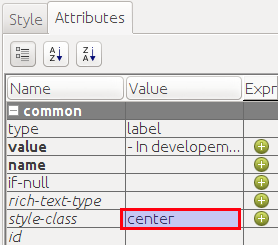
.centerThis CSS class selector style  (more info here) will be applied to multiple elements which have the style-class in the Attributes pane set to center:
Note: You must not prefix center with a dot in the attribute value!
.label.centerThis CSS class selector style  (more info here) will be applied to multiple elements which have the style-class in the Attributes pane set to center and are labels.
Note: The attribute value has to be set to only “center”!
report-footer label.noticeThis style will be applied to the label element with the class attribute set to notice in the report footer.


As you can see, the style rule name is a combination of various components.

Please find below a list of important report bands:
report-header
page-header
group-header
details-header
itemband
no-data-band
details-footer
page-footer
group-footer
report-footer
watermark

Important report elements:
label
text-field
number-field
date-field
message
band
sub-report

How to reference an external stylesheet

In the Structure pane select Master Report.
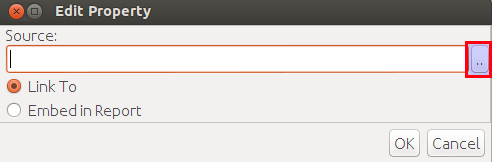
In the Attributes pane click the select button for the style-sheet-reference:


Click the Select button again:


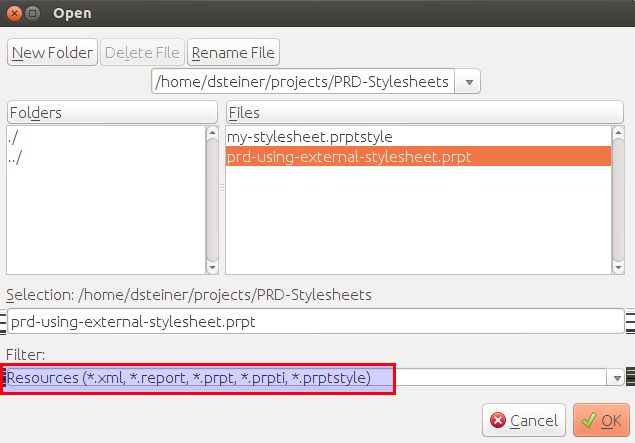
Next set the Filter to Resources and then select your stylesheet. Click OK:


How to assign styles to elements

Only if you used CSS class and id selector compliant style rule names, you must specify them
respectively in the style-class and id attributes in the Attributes pane.
Specifying a class:


Specifying an id:


Note: Only specify the name without the dot or hash prefix!

Here a report with various styles applied (not only id and class selectors):


Working with the stylesheet XML file

If you know what you are doing, you can directly open the *.prptstyle file in your favourite text editor and amend it there:

Note: You must be familiar with XML and must understand the structure of the stylesheet. This practice is not recommended for anyone not familiar with it.

Thursday, November 1, 2012

Pentaho Report Designer: How to configure error logging

Configure logging

By default PRD outputs the log to the console and to a file.
The log output file can be found in (Linux):
~/.pentaho/logs/prd.log

To configure the log settings amend the log4j.xml file in the PRD/resources folder. See here for more details.

To get a more detailed logging, change this section
 <root>
    <priority value="INFO"/>
    <appender-ref ref="CONSOLE"/>
    <appender-ref ref="FILE"/>
 </root>
to
 <root>
    <priority value="DEBUG"/>
    <appender-ref ref="CONSOLE"/>
    <appender-ref ref="FILE"/>
 </root>

Here are all possible values listed (see here for more details):
ALL
TRACE
DEBUG
FATAL
ERROR
INFO
OFF

To follow the log simply run (Usually this is not necessary as on Linux you have the terminal window open from which you started PRD, so the log will be display there):
tail -f ~/.pentaho/logs/prd.log

If you want to adjust the location where the log file is stored simple change following section:
<param name="file" value="${user.home}/.pentaho/logs/prd.log"/>